
Remember that error that you didn't have time to look into last Tuesday? Well, we remember it as well. And now, we've made sure that you can easily access it!
To give you an insight into our process, we'll go through some of the steps we went through during product development.
Here's the New Solution
You'll now find a new button at the top of the incident detail page for errors. Clicking on it will open a new component that we call the 'sample navigator'.
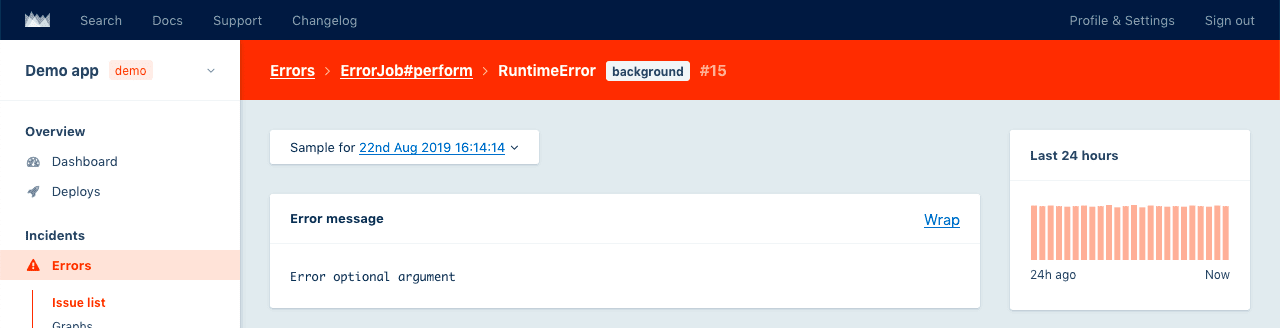
The top timeline displays the error count for a particular incident over the past seven days:
- You can click any bar to inspect errors for that hour.
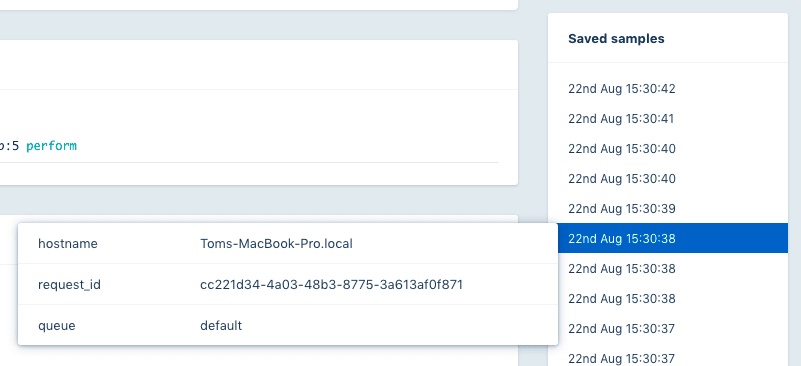
- Below it is a list with all samples that occurred in the selected hour.
- Hover over samples and instantly see metadata.
- Your selected sample is marked with a blue dot.
On clicking on one of the bars in the timeline, you'll jump to this point in time. If you're looking for samples from a specific point in time, let's say 2 days ago, you can click on a bar representing a specific hour from two days ago, and the samples table below will be updated with samples from that time.
Click the "< 7 Days"/"7 Days >" buttons at the top right of the timeline to go back or forward even further.
Here's How We Got to That Solution
Previously, this is what your flow looked like: you got a notification stating that a certain error happened, you clicked on it and landed on the page that we call the 'incident page'.
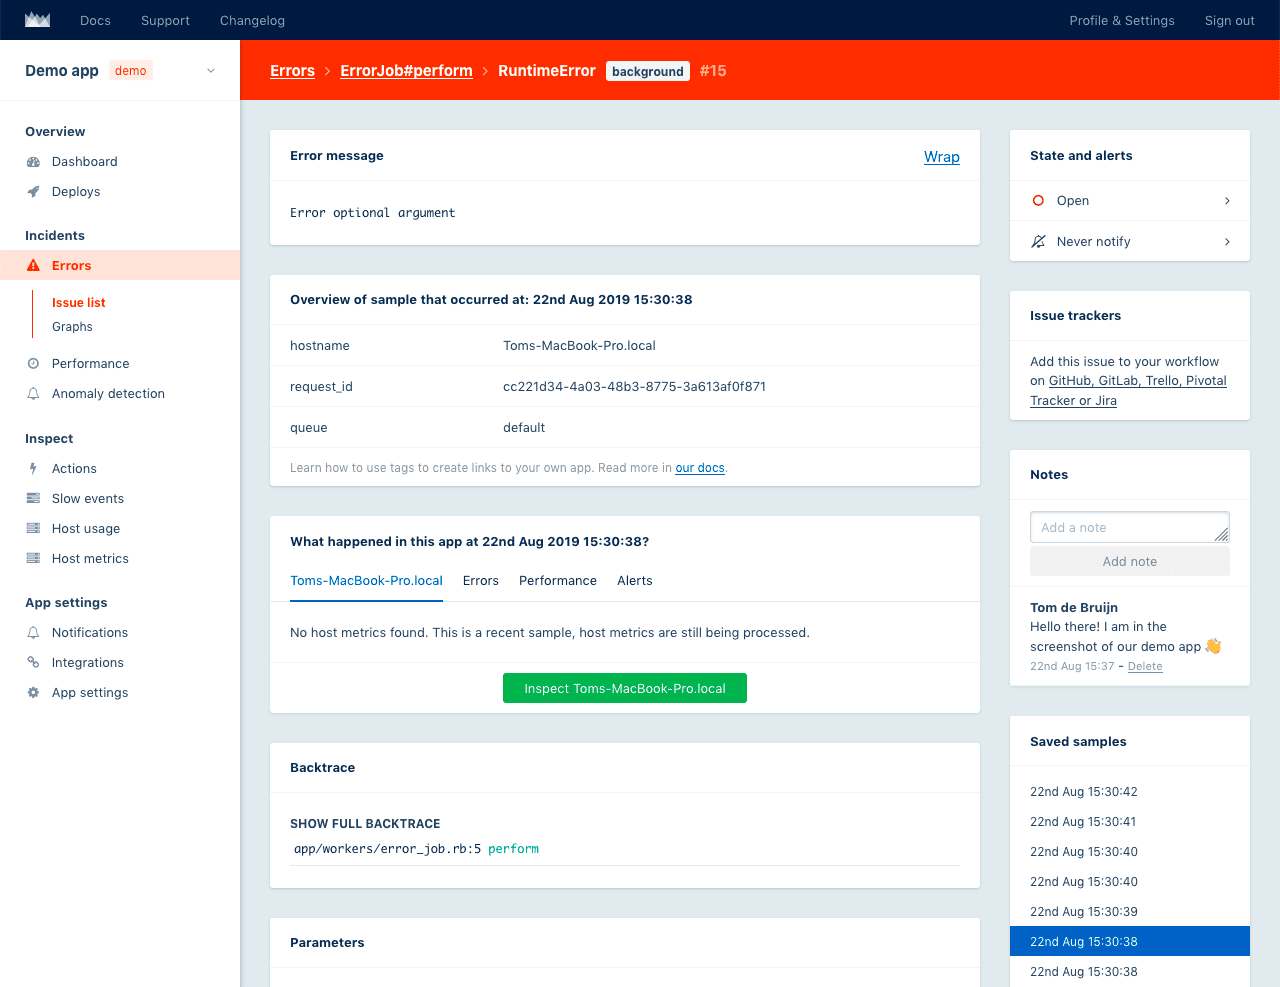
On this page, we showed details of the sample that you got notified about, as well as a list of samples that occurred recently.
Before today's update, you would have a list of 200 samples of other occurrences of the error on the action, displayed on the bottom right of the incident page.
You would be able to hover over the samples in this list and see some metadata, but not that much. Also, with the long list, once you jumped to a certain sample, it wasn't always easy to see which one you were looking at in the context of the list.
So the problems were:
- Our list of samples had a limit of 200.
- Finding older samples was not possible from the UI.
- Finding samples at a specific time and date wasn't possible.
Potential Solutions
To give you an insight into our process, here are the steps we went through during product development:
The easiest fix would have been to add lazy loading to the samples list. But scrolling in such a small area on the page wouldn't be very user-friendly, especially when going back days or even weeks. It would have involved a lot of scrolling.
We then thought of an overlay with a detailed samples list to create more space. We would add numbered pagination and a detail view of the sample so people could jump back larger distances. We realized this wouldn't work either since new samples continue to come in. This would add more pages to the front of the list. Samples on page 1 would suddenly be on page 3 on a page refresh, for example.

To remedy this, we thought of creating a snapshot in time that would prevent users from browsing to new samples. But this would have hidden the new data until you reopened the overlay, which would have been confusing.
We also considered using timestamps as a pagination option, but this wouldn't give a lot of context on when a lot of samples occurred, or how far back the list would go.

Eureka! AKA: Hard Work and More Iteration
From there, we realized that even though basic pagination wouldn't work, time still provided an easier context to the samples list. So we instead decided to show the history of the error's occurrences on a timeline. And that's how we landed upon the solution that we are shipping today.
With the new sample navigator, it's now a lot easier to traverse back further than the 200 most recent samples of an incident. To start with, we are rolling out a navigator for error incidents, but we are also working on one for performance incidents.
Let us know if you like the improvement and your thoughts on our design and product development process!
Wondering what you can do next?
Finished this article? Here are a few more things you can do:
- Try out AppSignal with a 30-day free trial.
- Reach out to our support team with any feedback or questions.
- Share this article on social media
Most popular AppSignal articles

Easily Monitor Multiple Heroku Apps with AppSignal
You can now monitor multiple Heroku apps from a single AppSignal instance.
See more
Fine-Tune Your Charts with Minutely Metrics in AppSignal
Discover how minutely metrics in AppSignal deliver precise performance monitoring. Check out detailed performance data, spot anomalies quickly, troubleshoot issues more efficiently, and optimize your application's performance.
See more
Secure Your Sign-Ins with AppSignal's Single Sign-On
Secure team sign-ins and enhance access management with AppSignal's Single Sign-On Business Add-On. Integrate AppSignal with your identity provider for seamless, secure access management.
See more

Tom de Bruijn
Tom is a developer at AppSignal, organizer, and writer from Amsterdam, The Netherlands.
All articles by Tom de BruijnBecome our next author!
AppSignal monitors your apps
AppSignal provides insights for Ruby, Rails, Elixir, Phoenix, Node.js, Express and many other frameworks and libraries. We are located in beautiful Amsterdam. We love stroopwafels. If you do too, let us know. We might send you some!

