
Performance monitoring is an important part of running a successful application. One of the most basic ways to tell the performance of something is to measure the duration each time it happens and distill statistics from it.
Mean
The mean or average of a collection of values is a good start to see how good or bad something behaves. It is calculated by summing all the values under consideration and then dividing by the number of occurrences.
In Ruby, this is what calculating the mean response time would look like:
def mean(array)
 (array.sum.to_f / array.length).round(2)
end

durations = [1,2,3,4,5,6,7,8,9,0]
mean(durations) #=> 4.5
Note: In the example, for a more accurate result when dividing, we cast the total duration value to a Float. Otherwise, Ruby would round down to the nearest Integer, returning 4 instead.
Median
Another useful statistic is the median. While it sounds similar, there’s a difference between the mean and median of a collection of values.
The median is the value separating the upper half of a set from the lower half of the set.
For a dataset with an odd number of values, you get the median by first sorting the values, then selecting the middle number. For a set with an even number of values, after sorting them, the median will be the mean of the two middle numbers.
def median(array)
  sorted_array = array.sort
  length = sorted_array.length

  if length.odd? # Middle number for odd arrays
    sorted_array[length / 2]
  else # Mean of two middle numbers
    first_value = sorted_array[length / 2]
    second_value = sorted_array[length / 2 - 1]
    (first_value + second_value) / 2.to_f
  end
end

# Even array
durations = [1,2,3,4,5,6,7,8,9,0]
median(durations) #=> 4.5

# Odd array
durations = [1,1,2,3,4,5,6,7,8,9,0]
median(durations) #=> 4
This statistic is a good way of seeing if there is a huge skew in data or a long tail.
durations = [1,2,3,4,5,2000]

median(durations) #=> 3.5
mean(durations) #=> 335.83
The mean for the durations above would be 335.83 because of the single outlier of 2000ms. The median, which is only 3.5, indicates that there is a skew.
By calculating both the mean and median of a dataset, you can figure out if there are any large outliers or a long tail.
The Problem with Mean
While mean and median are good indicators of performance, they don’t tell the whole story. If you request a webpage ten times, the mean could be very low, but one or more requests can still take a very long time to complete.
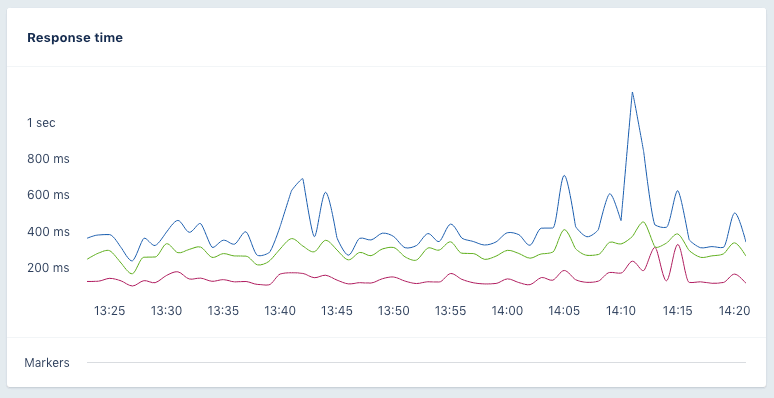
The image below shows the 99th (blue) and 90th (green) percentiles and the mean (red) for a certain action in AppSignal. You can see that the 99th and 90th are quite far from the mean and there are some spikes. This means that while your average customer has a good experience, every once in a while there's a user who has to wait almost twice as long for the page to render. Ideally, you would want to get all these values as close to each other as possible, creating a more consistent experience for all your users.
For example, given the following duration set where 10 customers request a page with a duration between 100 milliseconds and 1 second.
[100,100,100,100,100,100,100,100,100,1_000]
This would result in a mean of just 190ms while one user had a very bad experience of a 1 second response time. When only tracking the mean, it's easier to think your website has great performance, while in reality every once in a while a user has a terrible experience.
The example above is only for 10 requests, but imagine if you had a thousand requests per day, that would mean a hundred of those users had a terrible experience.
Percentiles
To give a better idea of the distribution of the values, we use percentiles. Percentiles are similar to the median - a number that signifies a point in the dataset where half of the set is below the number and half of it is above. Percentiles are similar in the sense that the 20th percentile means that 20% of the numbers in the dataset are below that number.
Given the following (sorted) set:
[100,100,200,200,300,300,400,400,500,5_000]
If we wanted to know the 20th percentile, we can calculate it in the following way: There are 10 values in the set. The wanted value is at position 1 (20.0 / 100 * 10 - 1) as our arrays start at zero. Since this array contains an even amount of items, we have to calculate the mean between the index (2) and index + 1 (3). This would result in a value of 150 for the 20th percentile.
A very naive Ruby implementation would look like this:
def percentile(array, wanted_percentile)
  sorted_array = array.sort

  index = (wanted_percentile.to_f / 100) * sorted_array.length - 1

  # Check if index is not a round number
  if index != index.to_i
    sorted_array.at(index.ceil)
  elsif sorted_array.length.even?
    first_value = sorted_array.at(index)
    second_value = sorted_array.at(index + 1)
    (first_value + second_value) / 2
  else
    sorted_array.at(index)
  end
end

# An array with an odd amount of numbers
durations = [100,200,200,300,300,400,400,500,5_000]

percentile(durations, 20) #=> 100
percentile(durations, 90) #=> 500
percentile(durations, 95) #=> 5000, index is a fraction, 9.5 the rounded index is 10

# An array with an even amount of numbers
durations = [100,100,200,200,300,300,400,400,500,5_000]

percentile(durations, 20) #=> 150, average of index 1 & 2 `(100 + 200) / 2`
percentile(durations, 90) #=> 2750, average of index 8 & 9 `(500 + 5000) / 2
percentile(durations, 95) #=> 500, index is a fraction, 8.55 the index is 9
This percentile function looks very similar to our median calculation and in fact, the median is the same as the 50th percentile.
durations = [1,2,3]

percentile(durations, 50) == median(durations) #=> true
AppSignal uses the statistics above to generate performance metrics for your Application. We do not just rely on the mean/average but calculate the 90th and 95th percentiles to show outliers that give a better idea of the distribution of your requests. Find out more on our performance tour page.
Oddities
Because of the way percentiles and averages are calculated, it’s sometimes possible to have the 90th percentile dip below the mean, for example, given the following dataset:
durations = [1,1,1,1,1,1,1,1,1,1,2000]

percentile(durations, 90) #=> 1
mean(durations) #=> 182.73
This would give us a mean of 182.73, and a 90th percentile of just 1.
If your metric collection system only shows the 90th percentile and the mean, you’d still be able to deduce that there’s a huge outlier somewhere in your dataset if the 90th percentile drops below the average.
👋 If you are liking this article, there is a lot more we wrote about Ruby (on Rails) performance, check out our Ruby performance monitoring checklist.
You are almost at 100% of this post
That's it for now! In another post, we're going to talk about how we efficiently store and calculate percentiles for all our customer's requests using Quantiles. If you have any questions or remarks about statistics and APMs, error tracking or performance monitoring, hit us up on Twitter @AppSignal or via email.