
For years we have kept the AppSignal interface so clean and simple we felt that having a dashboard overview wasn't necessary. All your insights could be gained with a few clicks. But after adding more powerful features (such as host metrics and anomaly detection), it's now time to add a big picture overview.
We're very excited to ship one of our most requested features: the AppSignal Dashboard! Starting today, when opening your app in AppSignal, you'll land on a new dashboard with live updating insights into the most important areas of your application. Find out what part of your app needs your attention right now.
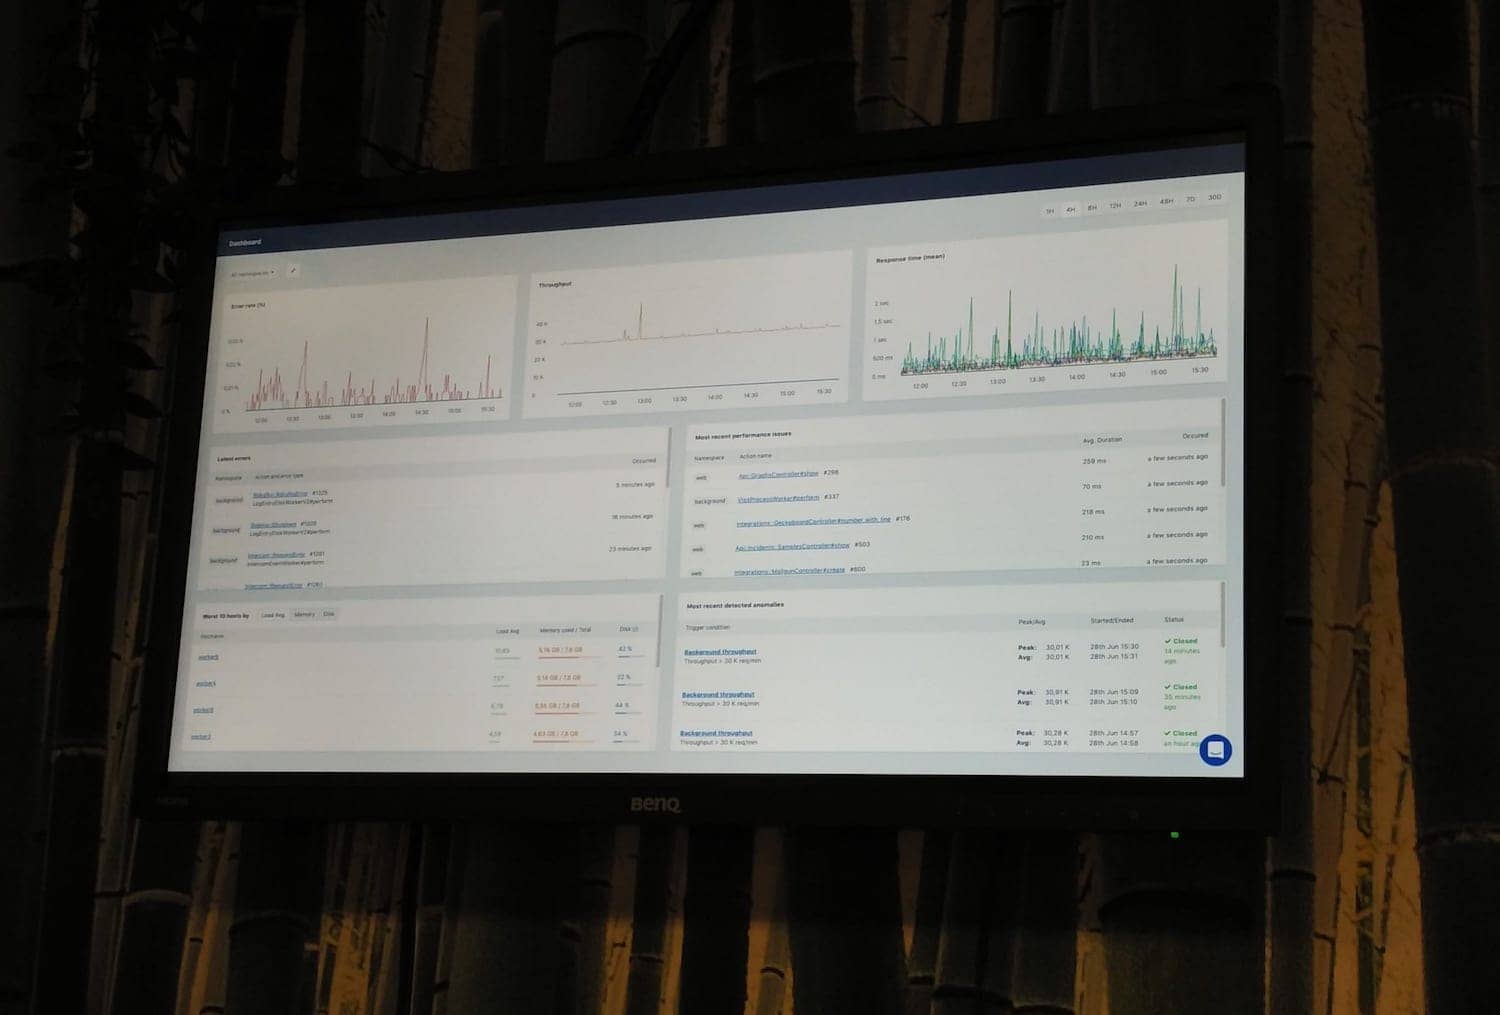
See how your app is doing at a glance, and dive deeper into specific issues by opening the incident or alert directly from the dashboard. Put it up on a monitor in your office and make sure you know immediately when something is wrong!
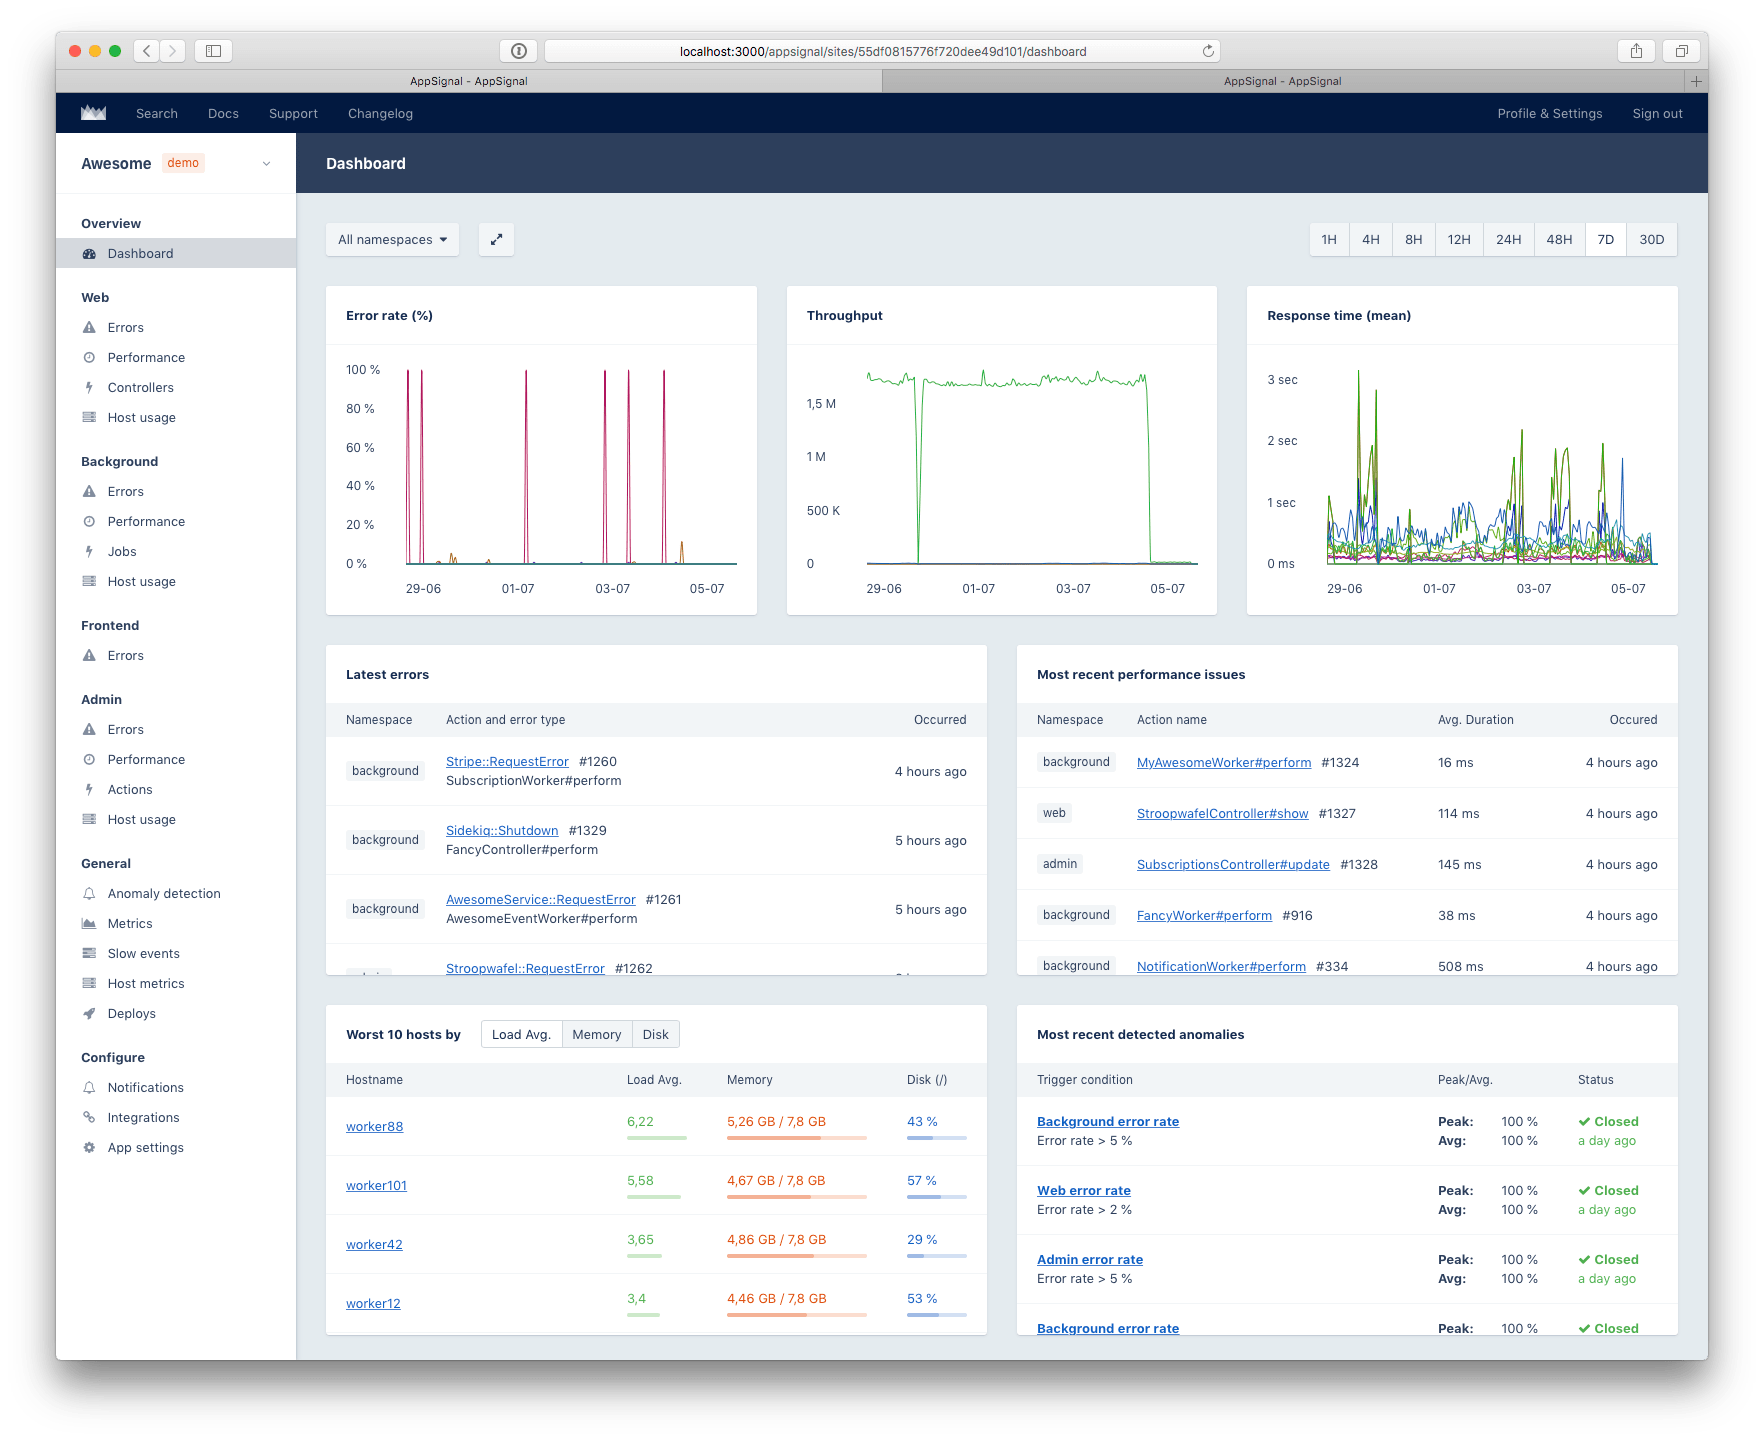
Included in the new dashboard are several components, such as:
- Live updating graphs for all namespaces about:
- Error rates
- Throughput
- Response times
- Tables with incidents that display:
- The most recently occurred errors
- The most recently detected performance issues
- The most recently detected anomalies
- A table with the worst hosts based on:
- Load average
- Memory usage
- Disk utilization
Filter your dashboard by namespace, change the timeframe (from the most recent hour to the last 30 days), and enable fullscreen mode to make it your own. It looks great on a huge TV with 1080p!
This dashboard is the first iteration and we hope to add more features later on. We appreciate any feedback to make the dashboard (and AppSignal) even more amazing. Let us know your thoughts at @AppSignal or via email.
Published
Wondering what you can do next?
- Try out AppSignal with a 30-day free trial.
- Reach out to our support team with any feedback or questions.
- Share this article on social media


Wes Oudshoorn
Chief Product Officer & Co-Founder. Once a rogue designer, now manager of colors at AppSignal. If our app looks great, it's to his credit. If something is wrong, he points at developers. Loves skiing.
All articles by Wes OudshoornBecome our next author!


AppSignal monitors your apps
AppSignal provides insights for Ruby, Rails, Elixir, Phoenix, Node.js, Express and many other frameworks and libraries. We are located in beautiful Amsterdam. We love stroopwafels. If you do too, let us know. We might send you some!