
We just launched a much improved way of keeping track of your hosts. In the past you could find both the host's usage (what are the response times on one of my frontend servers?) and the metrics (how much CPU power is my host using?) in one hosts section.
We've now split this feature into two more focussed parts: Host usage and Host metrics.
Host usage
Sometimes different hosts can have different performance characteristics, especially in a virtualized environment. You can now easily spot the differences in the Host usage screen.
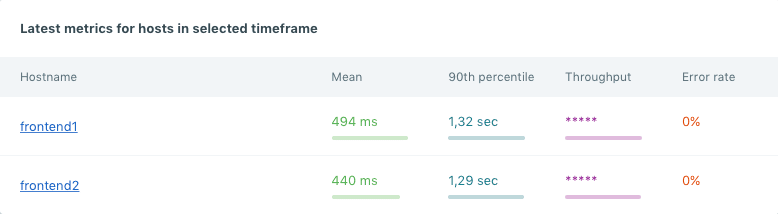
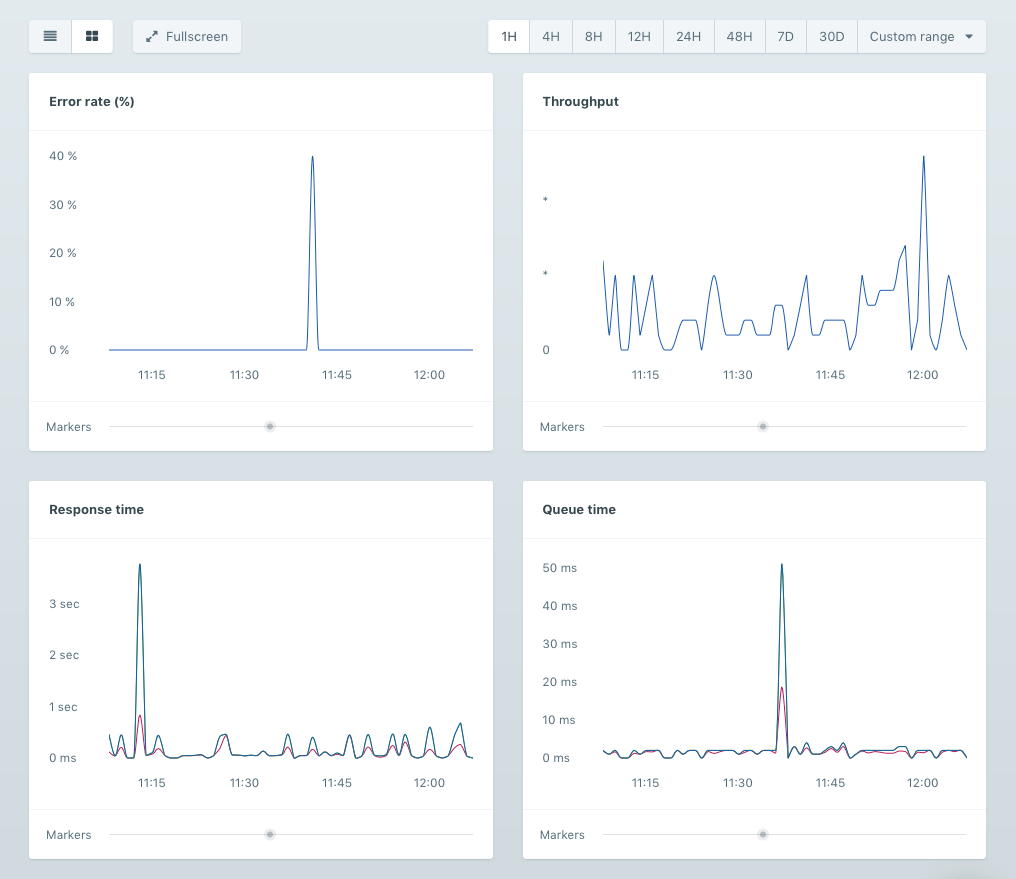
Once you see a host that's an outlier, you can see the graphs for that specific host:
These metrics are scoped per namespace. By default, we create web and background namespaces for you, but you have complete freedom in how you organize your namespaces. See the docs for Ruby and Elixir on how to customize namespaces.
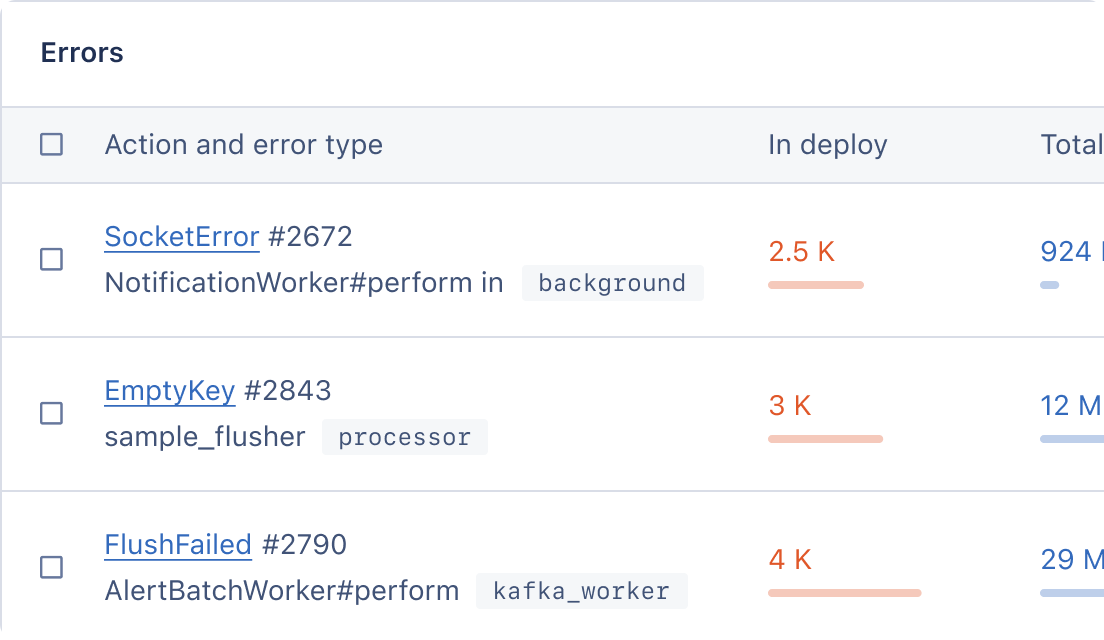
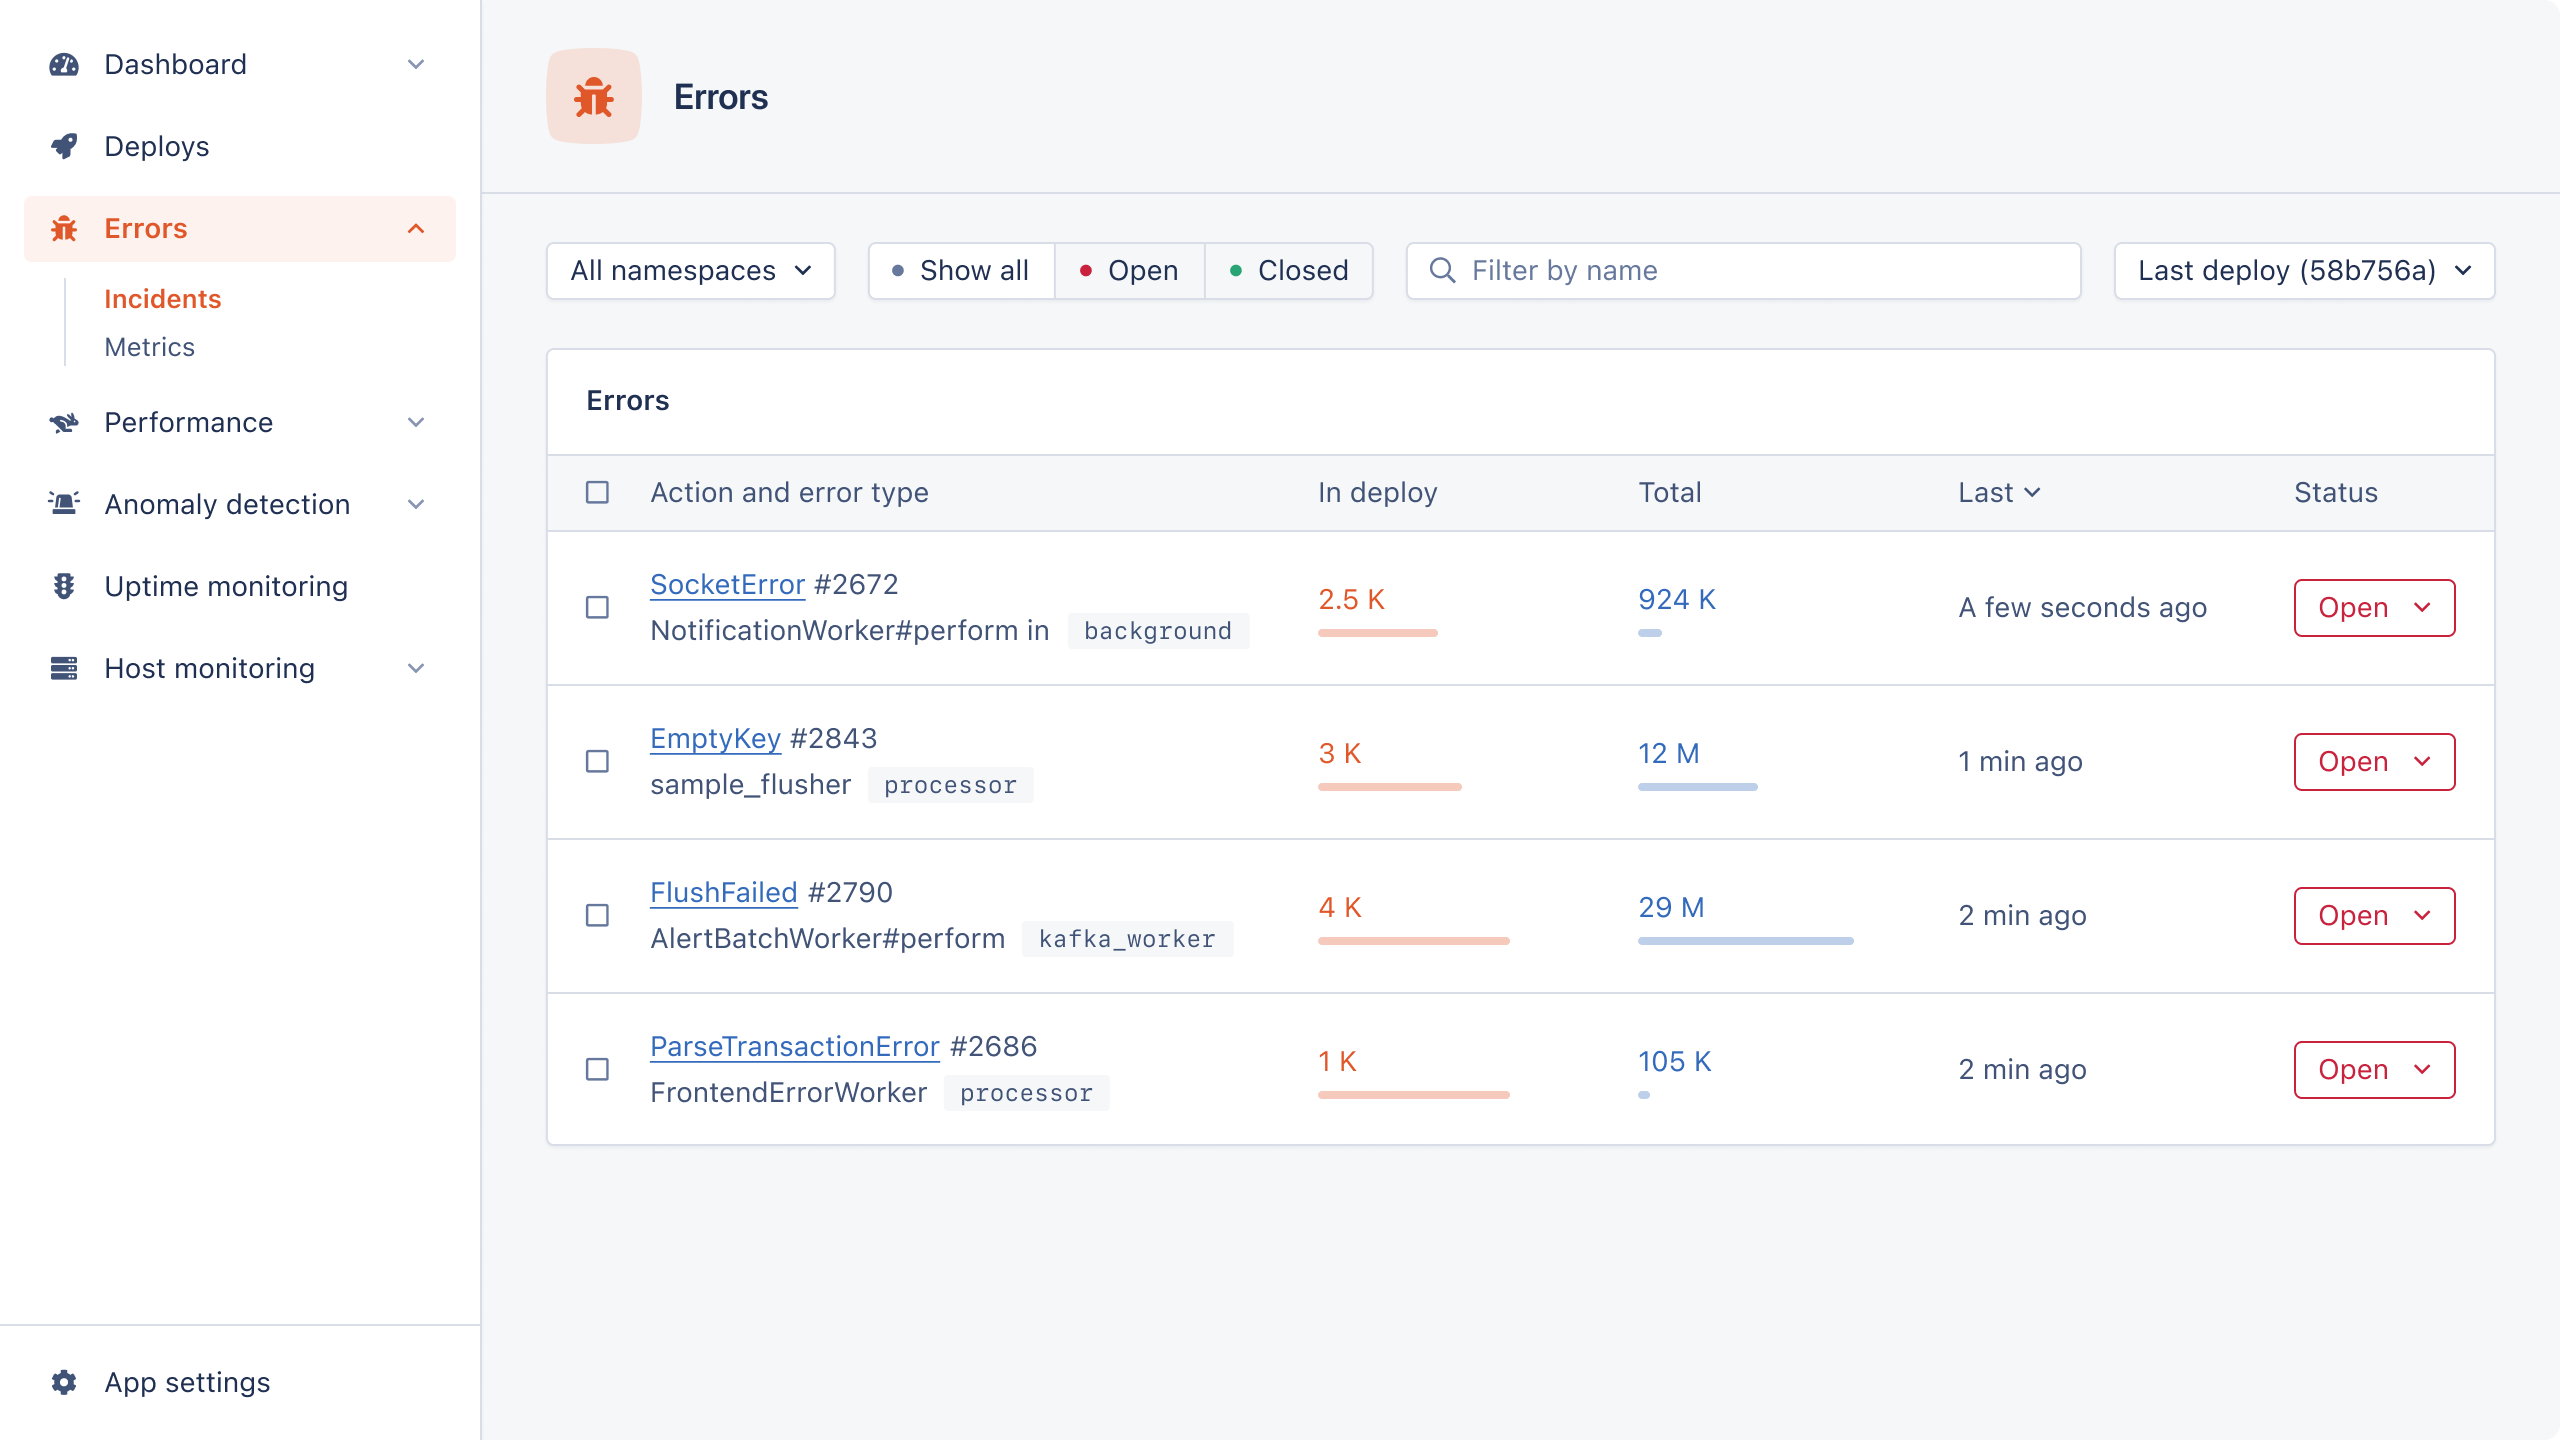
Host metrics
Your host's system metrics now have a dedicated menu item under the "General" heading in the main navigation. You can see a list of your hosts and easily get more information on individual ones.
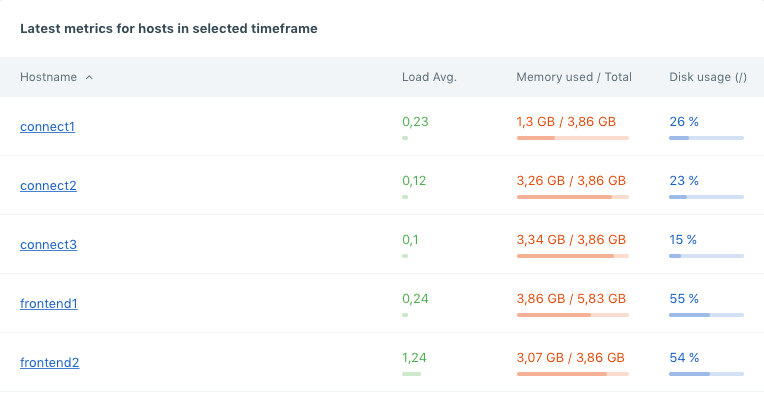
On the next screen, you can see graphs of metrics covering load average, CPU, memory, disk I/O, disk usage and network traffic.
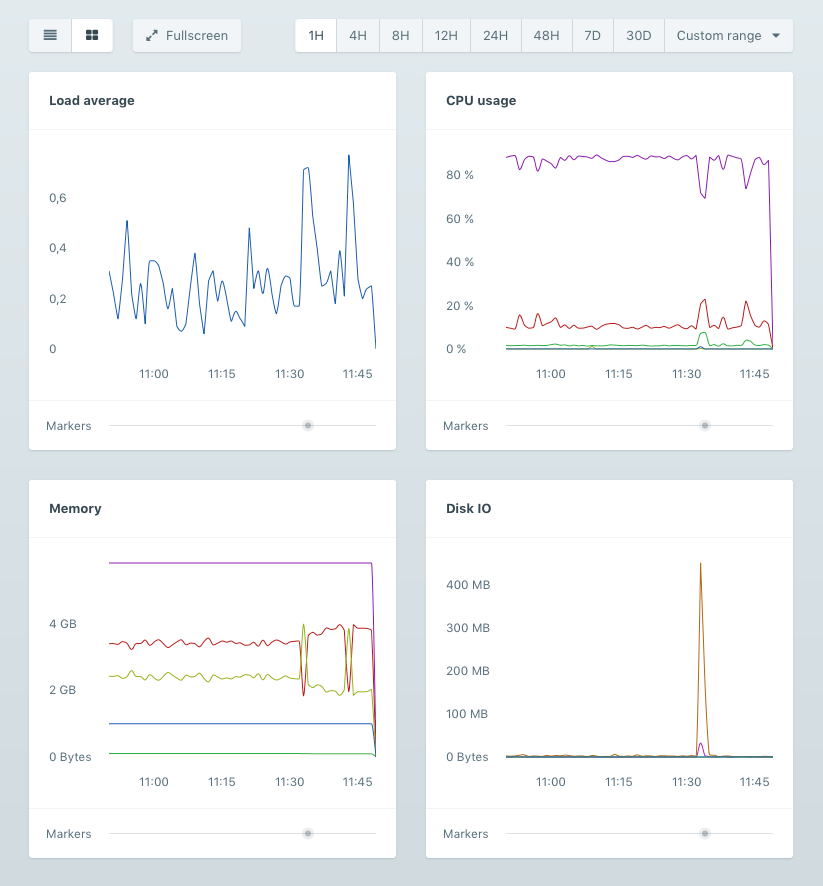
This separation makes it more convenient to get the full picture on your host's metrics.
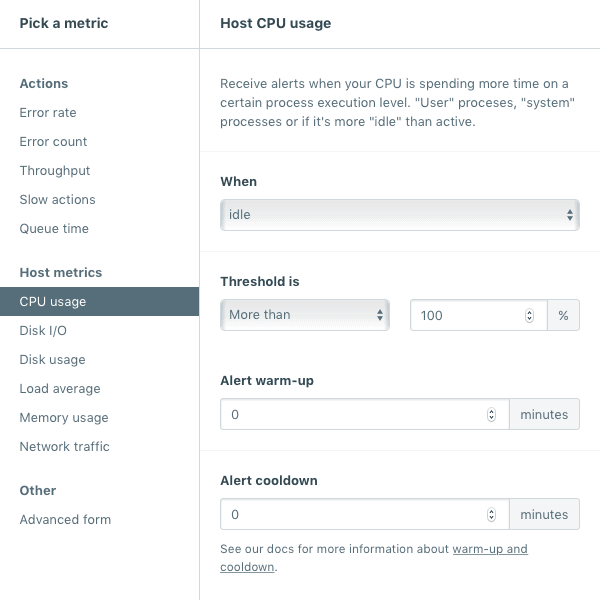
Get alerts for host metrics with anomaly detection
You may have noticed that we have a new feature in beta called Anomaly detection. It has full support for all these host metrics, so you can get alerted when your hosts are misbehaving.
Making your devops life easier
These features will make your devops life easier, again. And as we keep improving them based on customer feedback, we'd love to know what you think!