
We have improved our custom metrics offering with two recent Python releases. In release 1.1.1 of our Python package, we added the add_distribution_value helper, and in version 1.2.0, we added support for minutely probes, so you can measure the distribution of key data points in your Python application.
In this blog post, we'll show you how to set up custom metrics in your Python application to gain valuable insights without sifting through logs or querying databases.
What Are Custom Metrics?
You can use custom metrics to track any data point alongside your core metric data. Custom metrics give you additional context into how your application performs: for example, an active user count or the processing time of critical tasks.
AppSignal treats custom metrics like any other metric data point; you can create dashboards to visually track them. You can also set up alerts for when custom metrics meet a specific threshold (for example, if a task has been running slowly for over 15 minutes).
Custom Metric Types in AppSignal for Python
While our latest change allows you to measure distributions with Python, AppSignal also has Python helper functions for measuring custom metrics as gauges and counters:
| Measure | Function | Description |
|---|---|---|
| Gauge | set_gauge | A number that represents a particular value at a specific point in time that can frequently be overwritten, such as the count of an application's active users. |
| Counter | increment_counter | A number you can increment by any given value, such as the count of times a process has run. |
| Distribution | add_distribution_value | A collection of numbers from which we store an average, count, or percentile. You can use this to track a spread of values in a dataset - for example, the average user cart value of an e-commerce application, or the percentage of tasks completed within a desired time. |
Using Custom Metrics for Deeper Context
You can leverage custom metrics to measure virtually any data point within your application. This is especially handy if your application has high-volume mission-critical flows.
As an example, consider the process of making a purchase. An issue with a third-party payment provider might prevent users from completing their purchase but wouldn't trigger an exception within your application, as it lies outside of your stack.
However, with custom metrics, you can utilize measurable key performance points to help you proactively monitor your application for exceptions beyond the boundaries of its codebase (by monitoring your order count, for example).
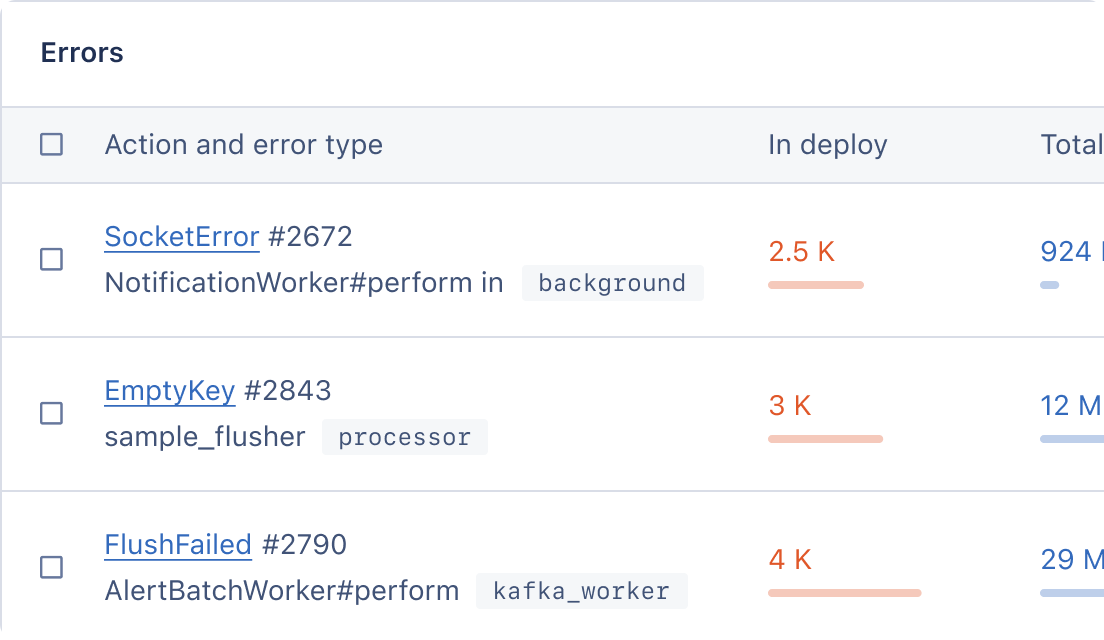
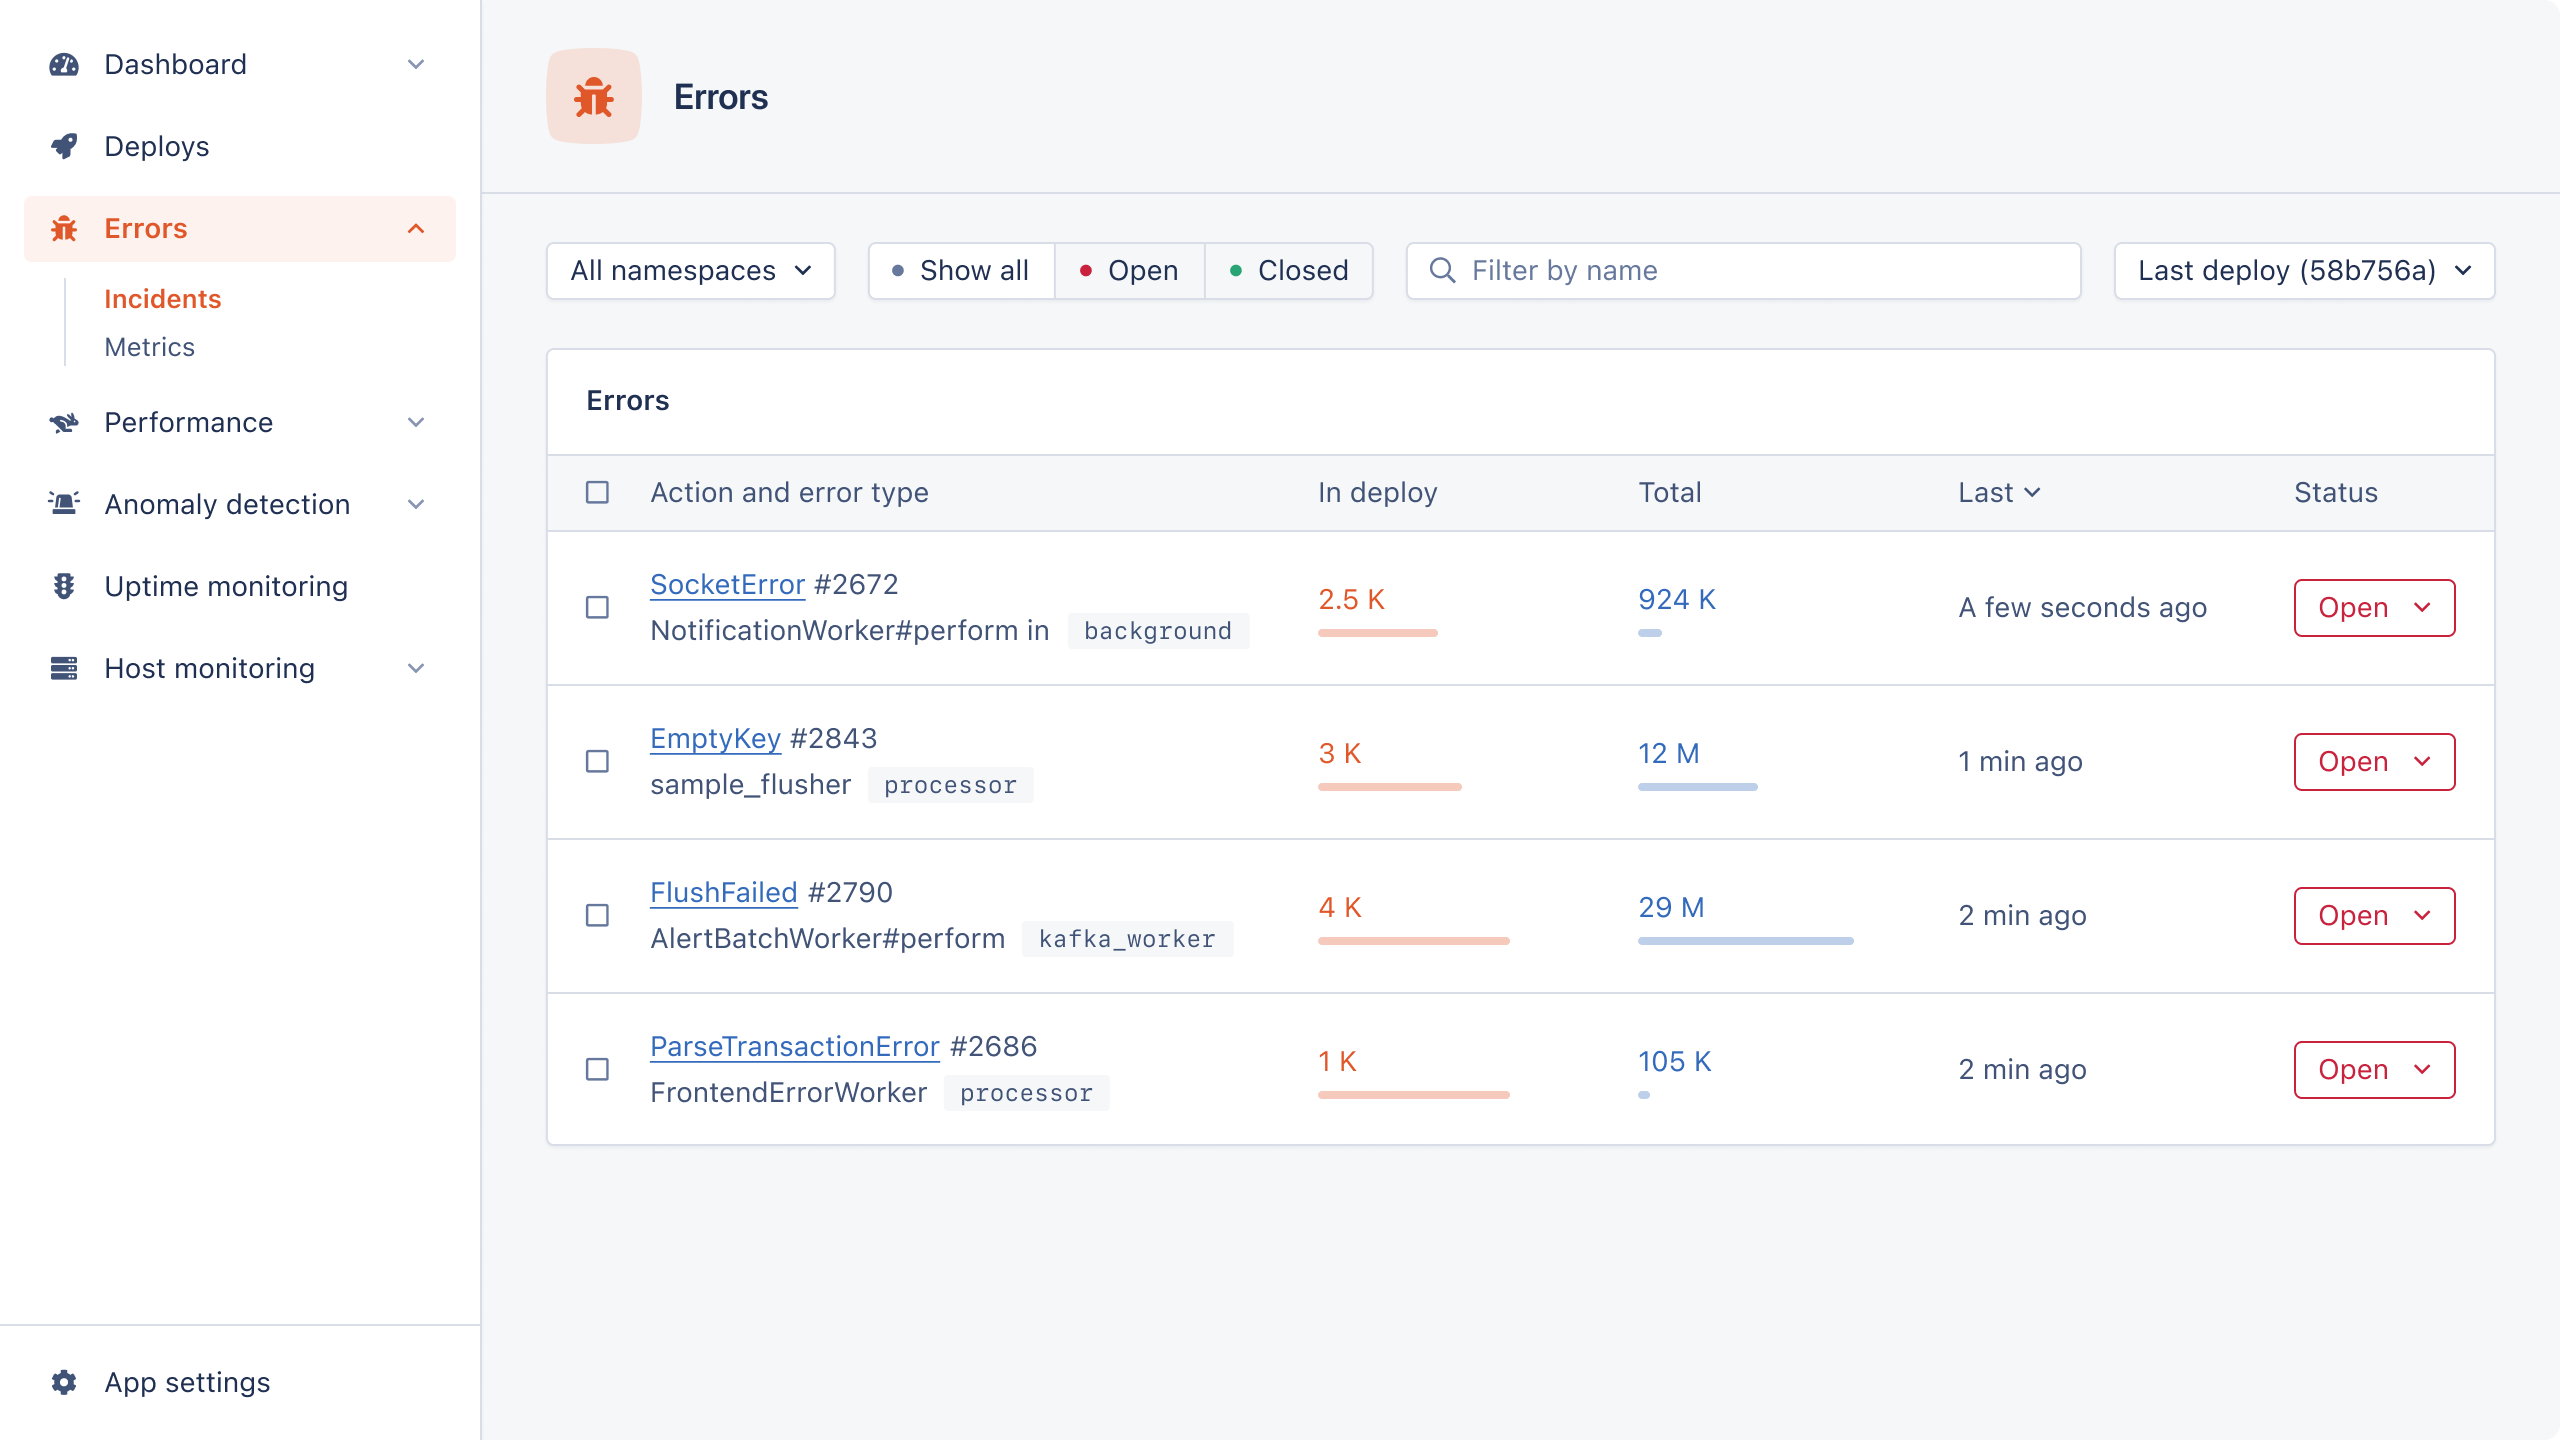
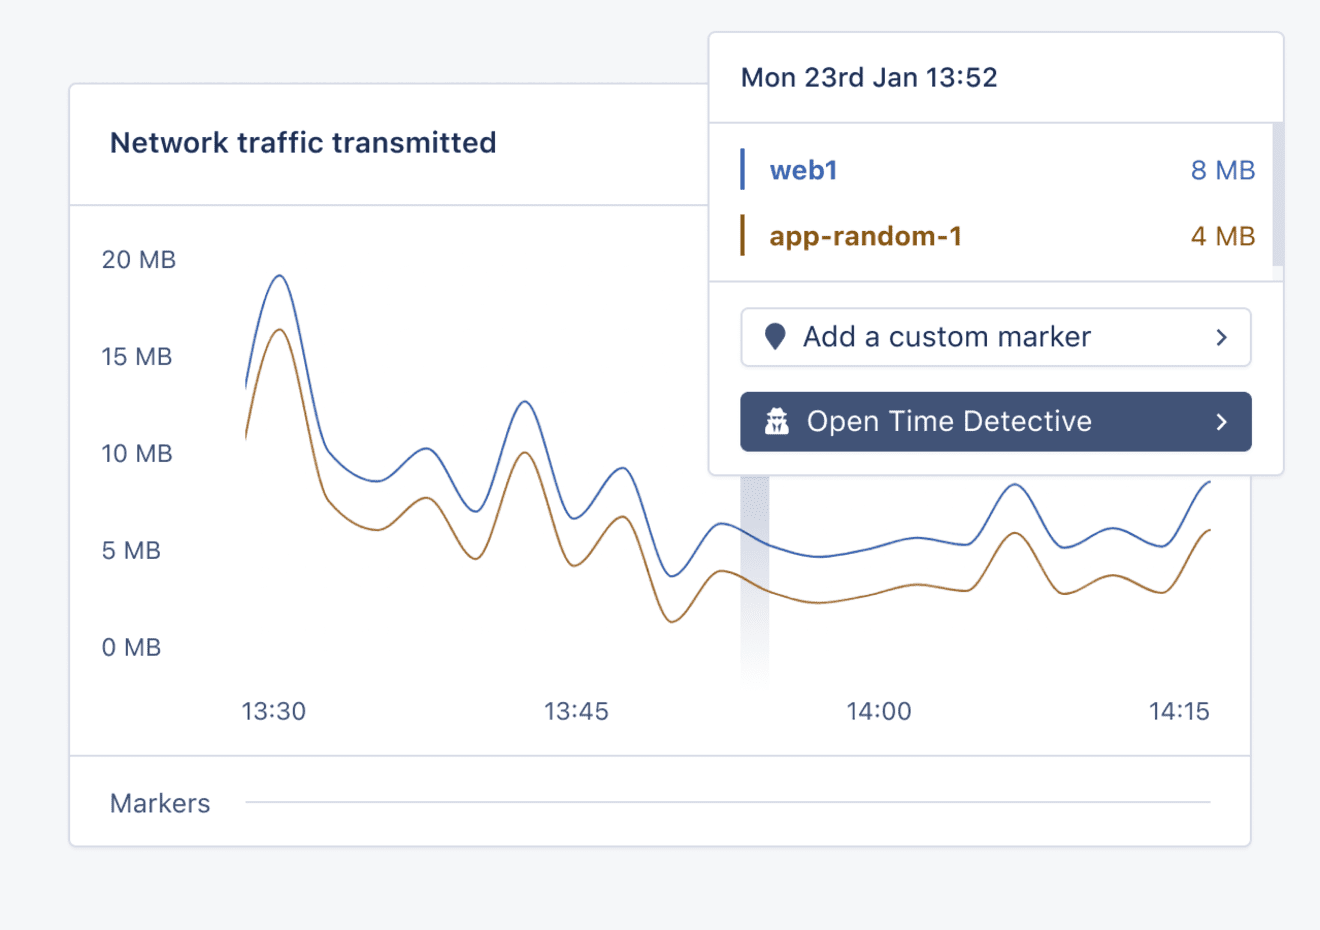
Custom metrics can help you quickly investigate and resolve an issue before it hurts your bottom line - e.g., if your app often processes dozens of orders per hour, but that count suddenly drops to zero:
Custom Metrics In Practice
For this article, let's imagine we've got a successful Django webshop that we're already monitoring with AppSignal. To broaden our understanding of our application's behavior, we're going to use custom metrics.
Gauge
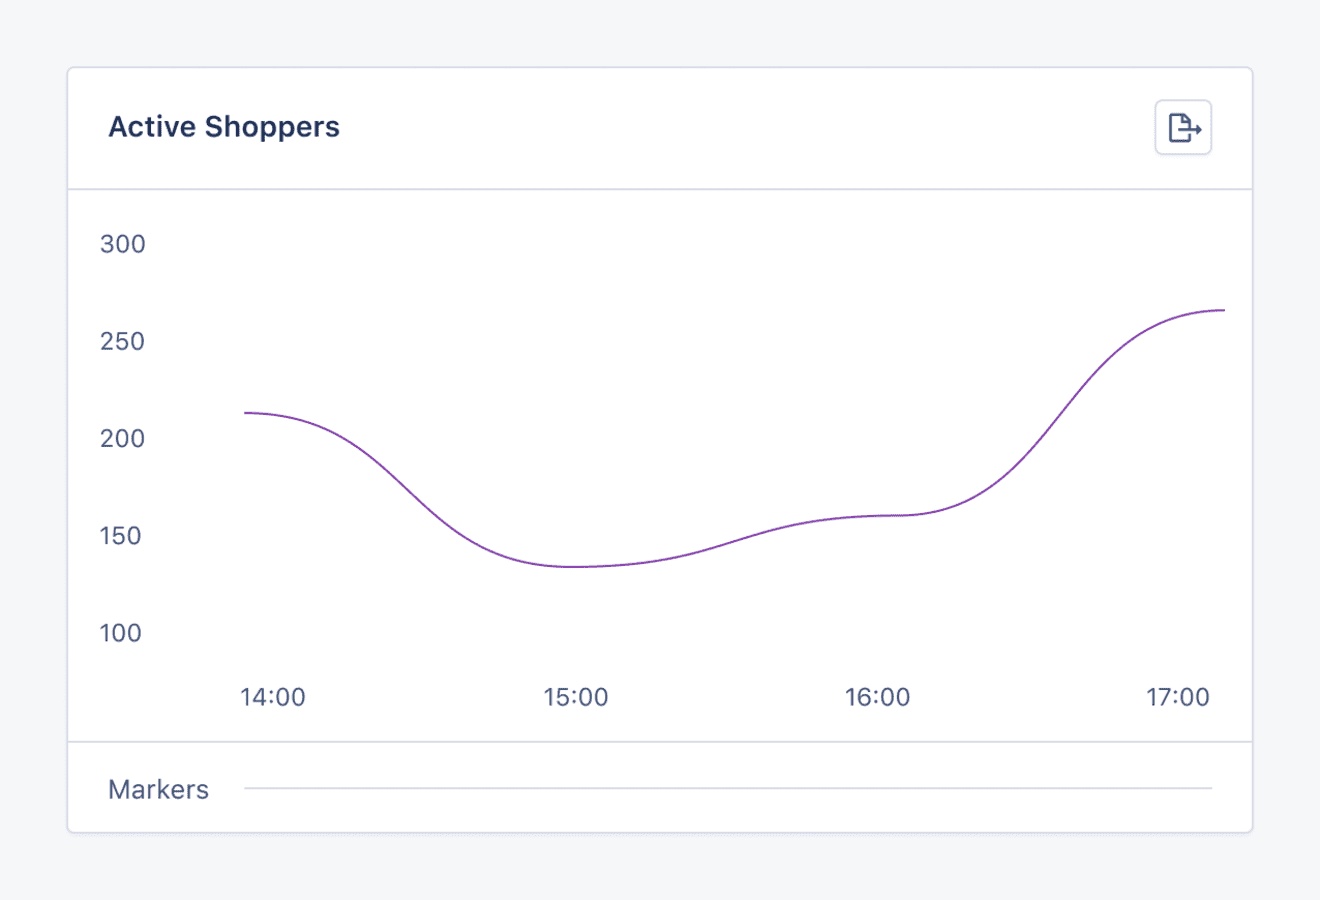
While AppSignal makes it easy for us to know when and where our application is less performant, we can use the set_gauge function to track active_shoppers and help us understand how scale impacts our performance.
To do this, we'll create a minutely probe task to report the count of carts that were updated within the last minute:
# import helper probe and set_gauge functions
from appsignal import probes, set_gauge

def set_active_carts_gauge():
    one_minute_ago = django.utils.timezone.now() + datetime.timedelta(minutes=-1)
    active_carts_count = Cart.objects.filter(updated_at__gte=one_minute_ago).count()
    set_gauge("active_shoppers", active_carts_count)

probes.register("active_shoppers", set_active_carts_gauge)
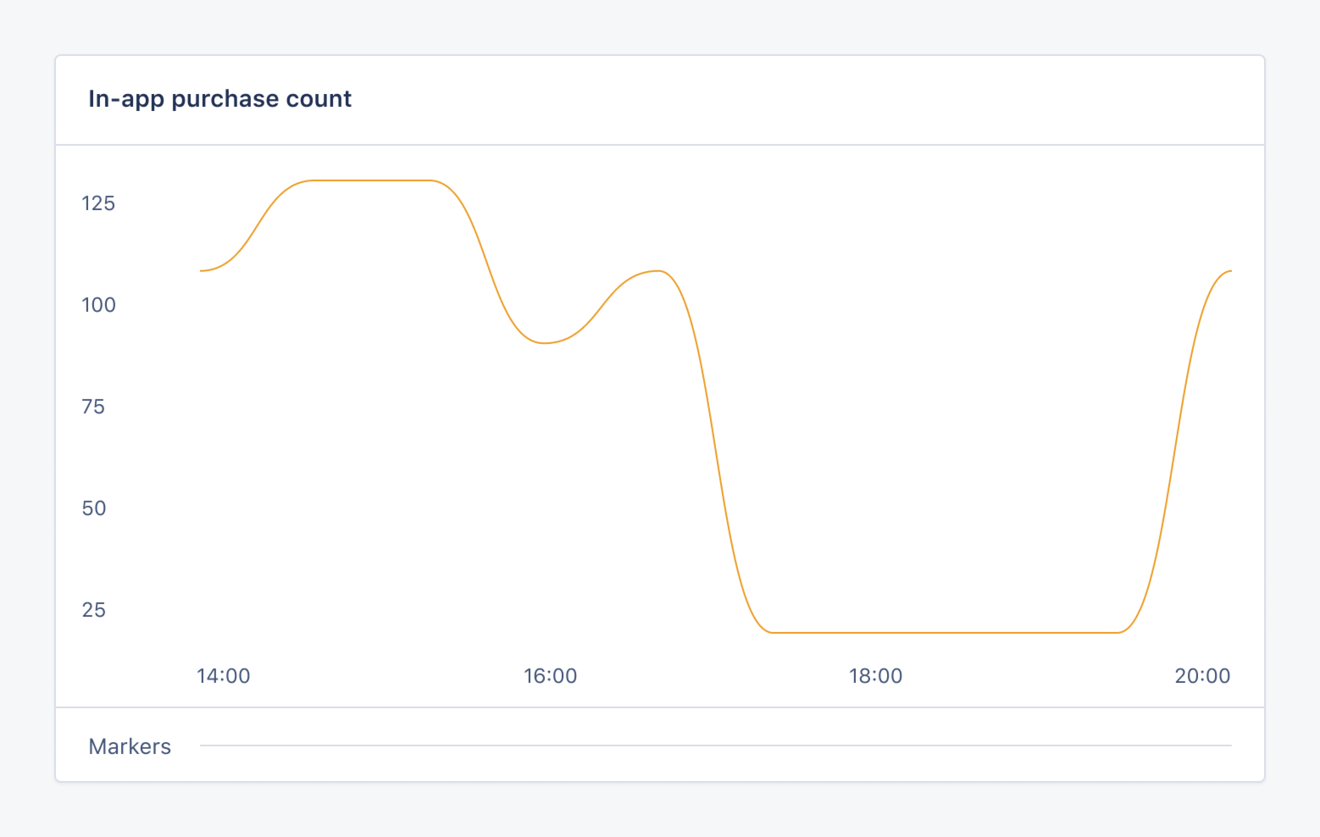
Once our Celery task is configured and sending data to AppSignal, we'll be able to create a chart in AppSignal that tracks how many active_shoppers are using our Django app:
Counter
As our application's usage grows, so too does the usage of critical infrastructure, like tasks.
Our Django application runs an invoice task for every order made. We can use the increment_counter helper function when running that task to give us instant insights into how many tasks our Django application is processing:
# Import increment_counter helper function
from appsignal import increment_counter

def create_order_invoice(order_id):
    # task logic
    increment_counter("invoice_count", 1)
We can also use the increment counter to track additional metrics, such as order_count, and create graphs to monitor invoice_count and order_count alongside one another:
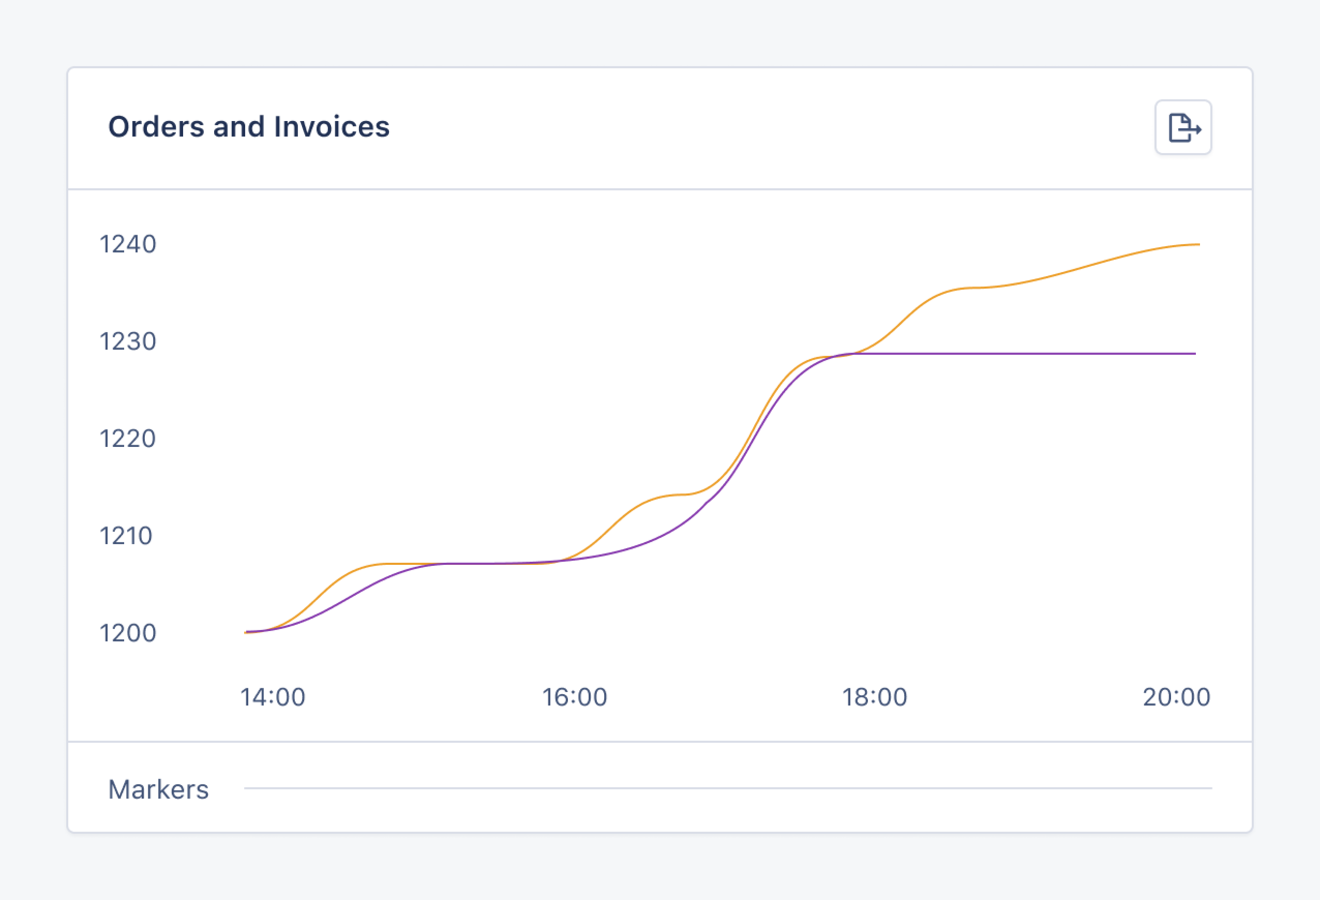
This graph gives us instant visual insights into our application's performance. For example, if we notice that the invoice_count value is flatlining against the order_count, we can proactively investigate to ensure there aren't any undetected issues preventing invoice tasks from running.
Distribution
Let's expand our tracking to include the distribution of item count per order. There are many reasons why this metric may be helpful. We may want to:
- Be notified when purchasing trends become irregular - for example, when there are excessive numbers of cart items.
- Ensure our app can scale with demand: large purchases may result in slow tasks and lead to bottlenecks.
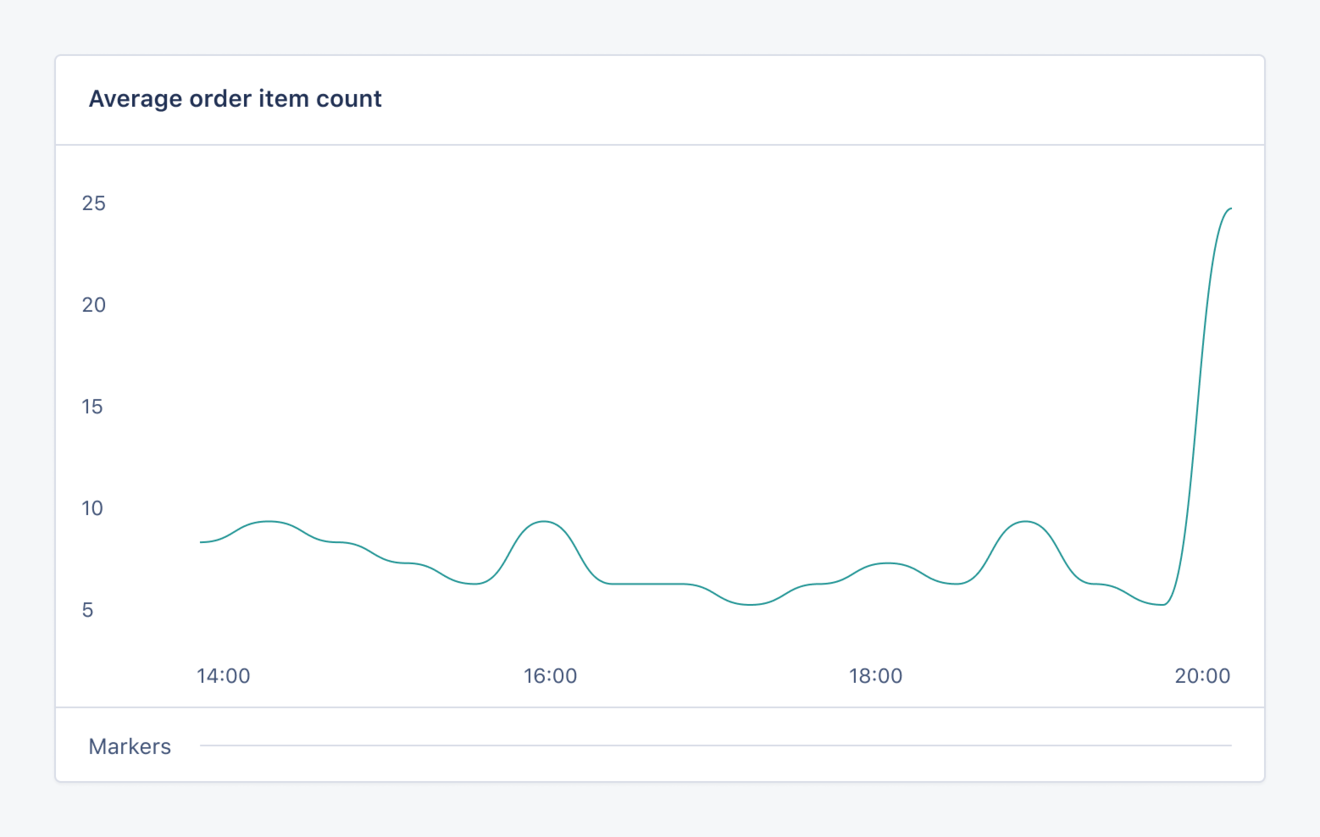
To do this, we can use the new add_distribution_value helper function to track the item count of our app's orders:
# import add_distribution_value helper function
from appsignal import add_distribution_value

def confirm_order(order_id):
    order = Order.objects.get(id=order_id)

    # function logic

    item_count = order.items.count()
    add_distribution_value("order_item_count", item_count)
Once implemented, our application will report the order_item_count custom metric value, which we can track on a dashboard (and use to configure alerts):
Custom Metrics for Powerful Python Insights
Custom metrics provide high-impact insights into your Python application's performance, removing the need to analyze dozens of samples, search through thousands of log-lines, or painfully reproduce a problem.
When properly utilized, custom metrics can help you:
- Quickly find the cause of an issue
- Easily contextualize application performance
- Reduce reproduction times
- Save on unnecessary log storage
If you're interested in using custom metrics to level up your Python performance monitoring, you can read more in-depth information in our custom metrics documentation. We've also got in-depth documentation about our minutely probes helper functions.
AppSignal: Making Monitoring Simple
At AppSignal, we work hard to make monitoring your application feel like magic. We're here to help developers on projects of all shapes and sizes to get the most out of their applications.
- That's why we're the only APM to offer:
- Simple, straight-forward pricing
- A flexible upgrade policy
- Friendly, free dev-to-dev support
- A 30-day free trial
- Sweet, sweet stroopwafels for all new customers 🧇
Sign up today and join thousands of developers who use AppSignal daily to monitor, maintain, and enhance their applications.