
To update a document in MongoDB, I used to fetch it, update the values, and save back the entry. I would question the need for an update method. Looking back, it's evident that performance optimizations were hardly a concern when working on a personal project.
Working with a larger dataset is a whole different story, though. This is where no-code tools can't help. In this article, I'll share some of my learnings when it comes to working in MongoDB with millions of documents. We'll see how best to optimize performance.
Let's get started!
What We'll Cover
Here's what we'll go through in this post:
- Data modeling
- Starting with
explain - Provisioning your hardware resources
- Monitoring MongoDB queries
- Managing indexes
- Limiting query output
- Using projection
- Connection pooling with Mongoose
- Batch operations
- Soft deletes
- Caching layer for faster access
- Aggregation best practices
Data Modelling in MongoDB
When designing the data layer, it's absolutely crucial to know the end goals of a product. These are some of the crucial questions you must ask yourself:
- Do you want to show all the items on a single page?
- Does owner info need to be present with the item description? Would the owner name suffice?
- Can owners update their profile details? How often? Once a day/week/month?
Why? Because answering questions like these helps you chart relationships between your entities (in this case, owner and item). That's why drawing an Entity Relationship Diagram helps.
For example, if owners can edit their profile details, embedding them in every item they list might not be the right choice (as you'll need to update their profile details for every item they have previously listed). Whereas if items reference the owner document, you only need to update the owner details once.
This is where embedding vs. referencing comes in:
- Embedding is when you take the complete owner object and put it inside an item object. This means the owner object is added to every item someone creates. This is data duplicity (or, more formally, denormalization).
- Referencing means just adding a unique identifier in the item's object for the owner, solving the data duplicity issue.
To summarize, the pros and cons of the embedding approach are as follows:
Pros:
- Faster read
- Atomic behavior (during writes)
Cons:
- Data duplication
- Limit on max document size (16MB)
Now let's turn to analyzing queries using explain in MongoDB.
Starting with explain
MongoDB provides a very neat way to analyze your queries with explain. You can learn a lot about how your query performs by looking at the query plan and execution stats. We have a sample query on MongoDB playground:
db.collection.aggregate([
  {
    "$project": {
      "_id": 0
    }
  }
]).explain("executionStats")
Let's understand the explain output:
{
  "stages": [
    {
      "$cursor": {
        "executionStats": {
          "executionStages": {
            "docsExamined": 5,
            "executionTimeMillisEstimate": 0,
            "nReturned": 5,
            "stage": "COLLSCAN",
          },
          "executionSuccess": true,
          "executionTimeMillis": 0,
          "nReturned": 5,
          "totalDocsExamined": 5,
          "totalKeysExamined": 0
        },
        "queryPlanner": {
          "rejectedPlans": [],
          "winningPlan": {
            "direction": "forward",
            "stage": "COLLSCAN"
          }
        }
      },
      "executionTimeMillisEstimate": NumberLong(0),
      "nReturned": NumberLong(5)
    },
    {
      "$project": {
        "_id": false
      },
      "executionTimeMillisEstimate": NumberLong(0),
      "nReturned": NumberLong(5)
    }
  ]
}
I've removed most of the output for brevity, as we're only interested in these things:
queryPlanner.winningPlan.stage: This indicatesCOLLSCAN, i.e., a collection scan.executionStats.nReturned: Shows the number of documents returned in the output.executionStats.totalKeysExamined: Since the query doesn't use an index, this value is 0.executionStats.totalDocumentsExamined: This shows the total number of documents that the query has to go through.executionStats.executionTimeMillis: This is the time (in ms) the query took.executionStats.executionStages: In the case of a complex query, there might be multiple stages involved. This shows all of them.
To summarize, running explain on your queries tells you whether an index is being used, all the execution stages, and the amount of time your query takes.
Provisioning your Hardware Resources
As the common (unspoken) rule in the distributed systems world goes — always provision your hardware resources with a sufficient buffer. Is usage around 1.7 GB? Don't go for a t3.small EC2 instance with 2 GB of RAM. Going for neck-to-neck calculations often results in chaos.
Insufficient RAM, CPU, or I/O can lead to higher latencies, sluggish queries and operations, and even aggregation pipeline execution times can become unbearable.
To know the sweet spot for hardware, a good first step is:
- Regularly monitor CPU, memory, disk I/O, and network during peak load times. Check if your database is capable of handling the load. If you use a tool like AppSignal, it automatically monitors host and memory metrics for you.
- Run the mongostat command to view metrics such as connections, read/write per second, virtual memory, resident memory, network in/out, and much more.
- Run MongoDB's built-in database profiler (it comes with an overhead) to collect stats about your queries and analyze the slow ones.
- You can even go for an external monitoring solution — MongoDB OpsManager or Atlas, which adds nice visualizations to better understand the patterns.
But it's hard to improve something you can't observe. Time to monitor our queries.
Monitoring MongoDB Queries for Node.js
The goal of monitoring your MongoDB queries is to ensure you are the first to know when anomalies occur. A slow query not only degrades user experience but can also affect other clients (e.g., there might be no idle connections in a pool due to longer holds).
Logging does not help in observing query performance data. It's simply not the right tool for the job. In times like this, where you need a holistic view of your application performance, Application Performance Monitoring (APM) helps.
I've set up AppSignal for my Node.js API. And the best part is there are no extra steps needed to enable the MongoDB/Mongoose integration.
Let's use an example.
Here's a GET /item/:hash route that fetches an item by hash and returns it to the client:
const tracer = trace.getTracer("my-nodejs-app");

router.get("/:hash", async (req, res) => {
  try {
    const { hash } = req.params;

    setRootName("Fetch Item");

    tracer.startActiveSpan("find | Items | SUCCEEDED", async (span) => {
      setCategory("query.mongodb");
      setBody(`Item.findOne({ hash: ${hash}})`);
      setTag("operationType", "fetch");

      const Item = mongoClient.collection("items");
      const item = await Item.findOne({ hash });

      res.json({
        item,
        status: 200,
        message: "Item read successfully!",
      });

      span.end();
    });
  } catch (err) {
    res.json({
      item: null,
      status: err.code || err.statusCode || 500,
      message:
        err.message || "Something went wrong while reading item from DB!",
    });
  }
});
Please note that setting the category to query.mongodb is important because AppSignal detects MongoDB events by looking for the ".mongodb" suffix in the event name. You can read more about structuring event names in AppSignal's documentation.
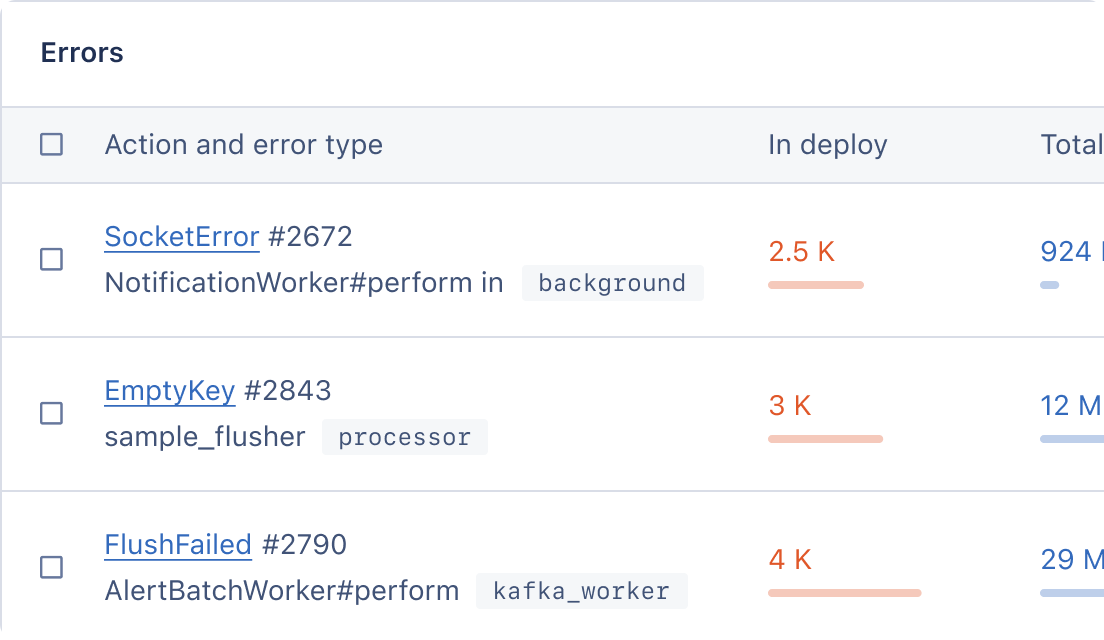
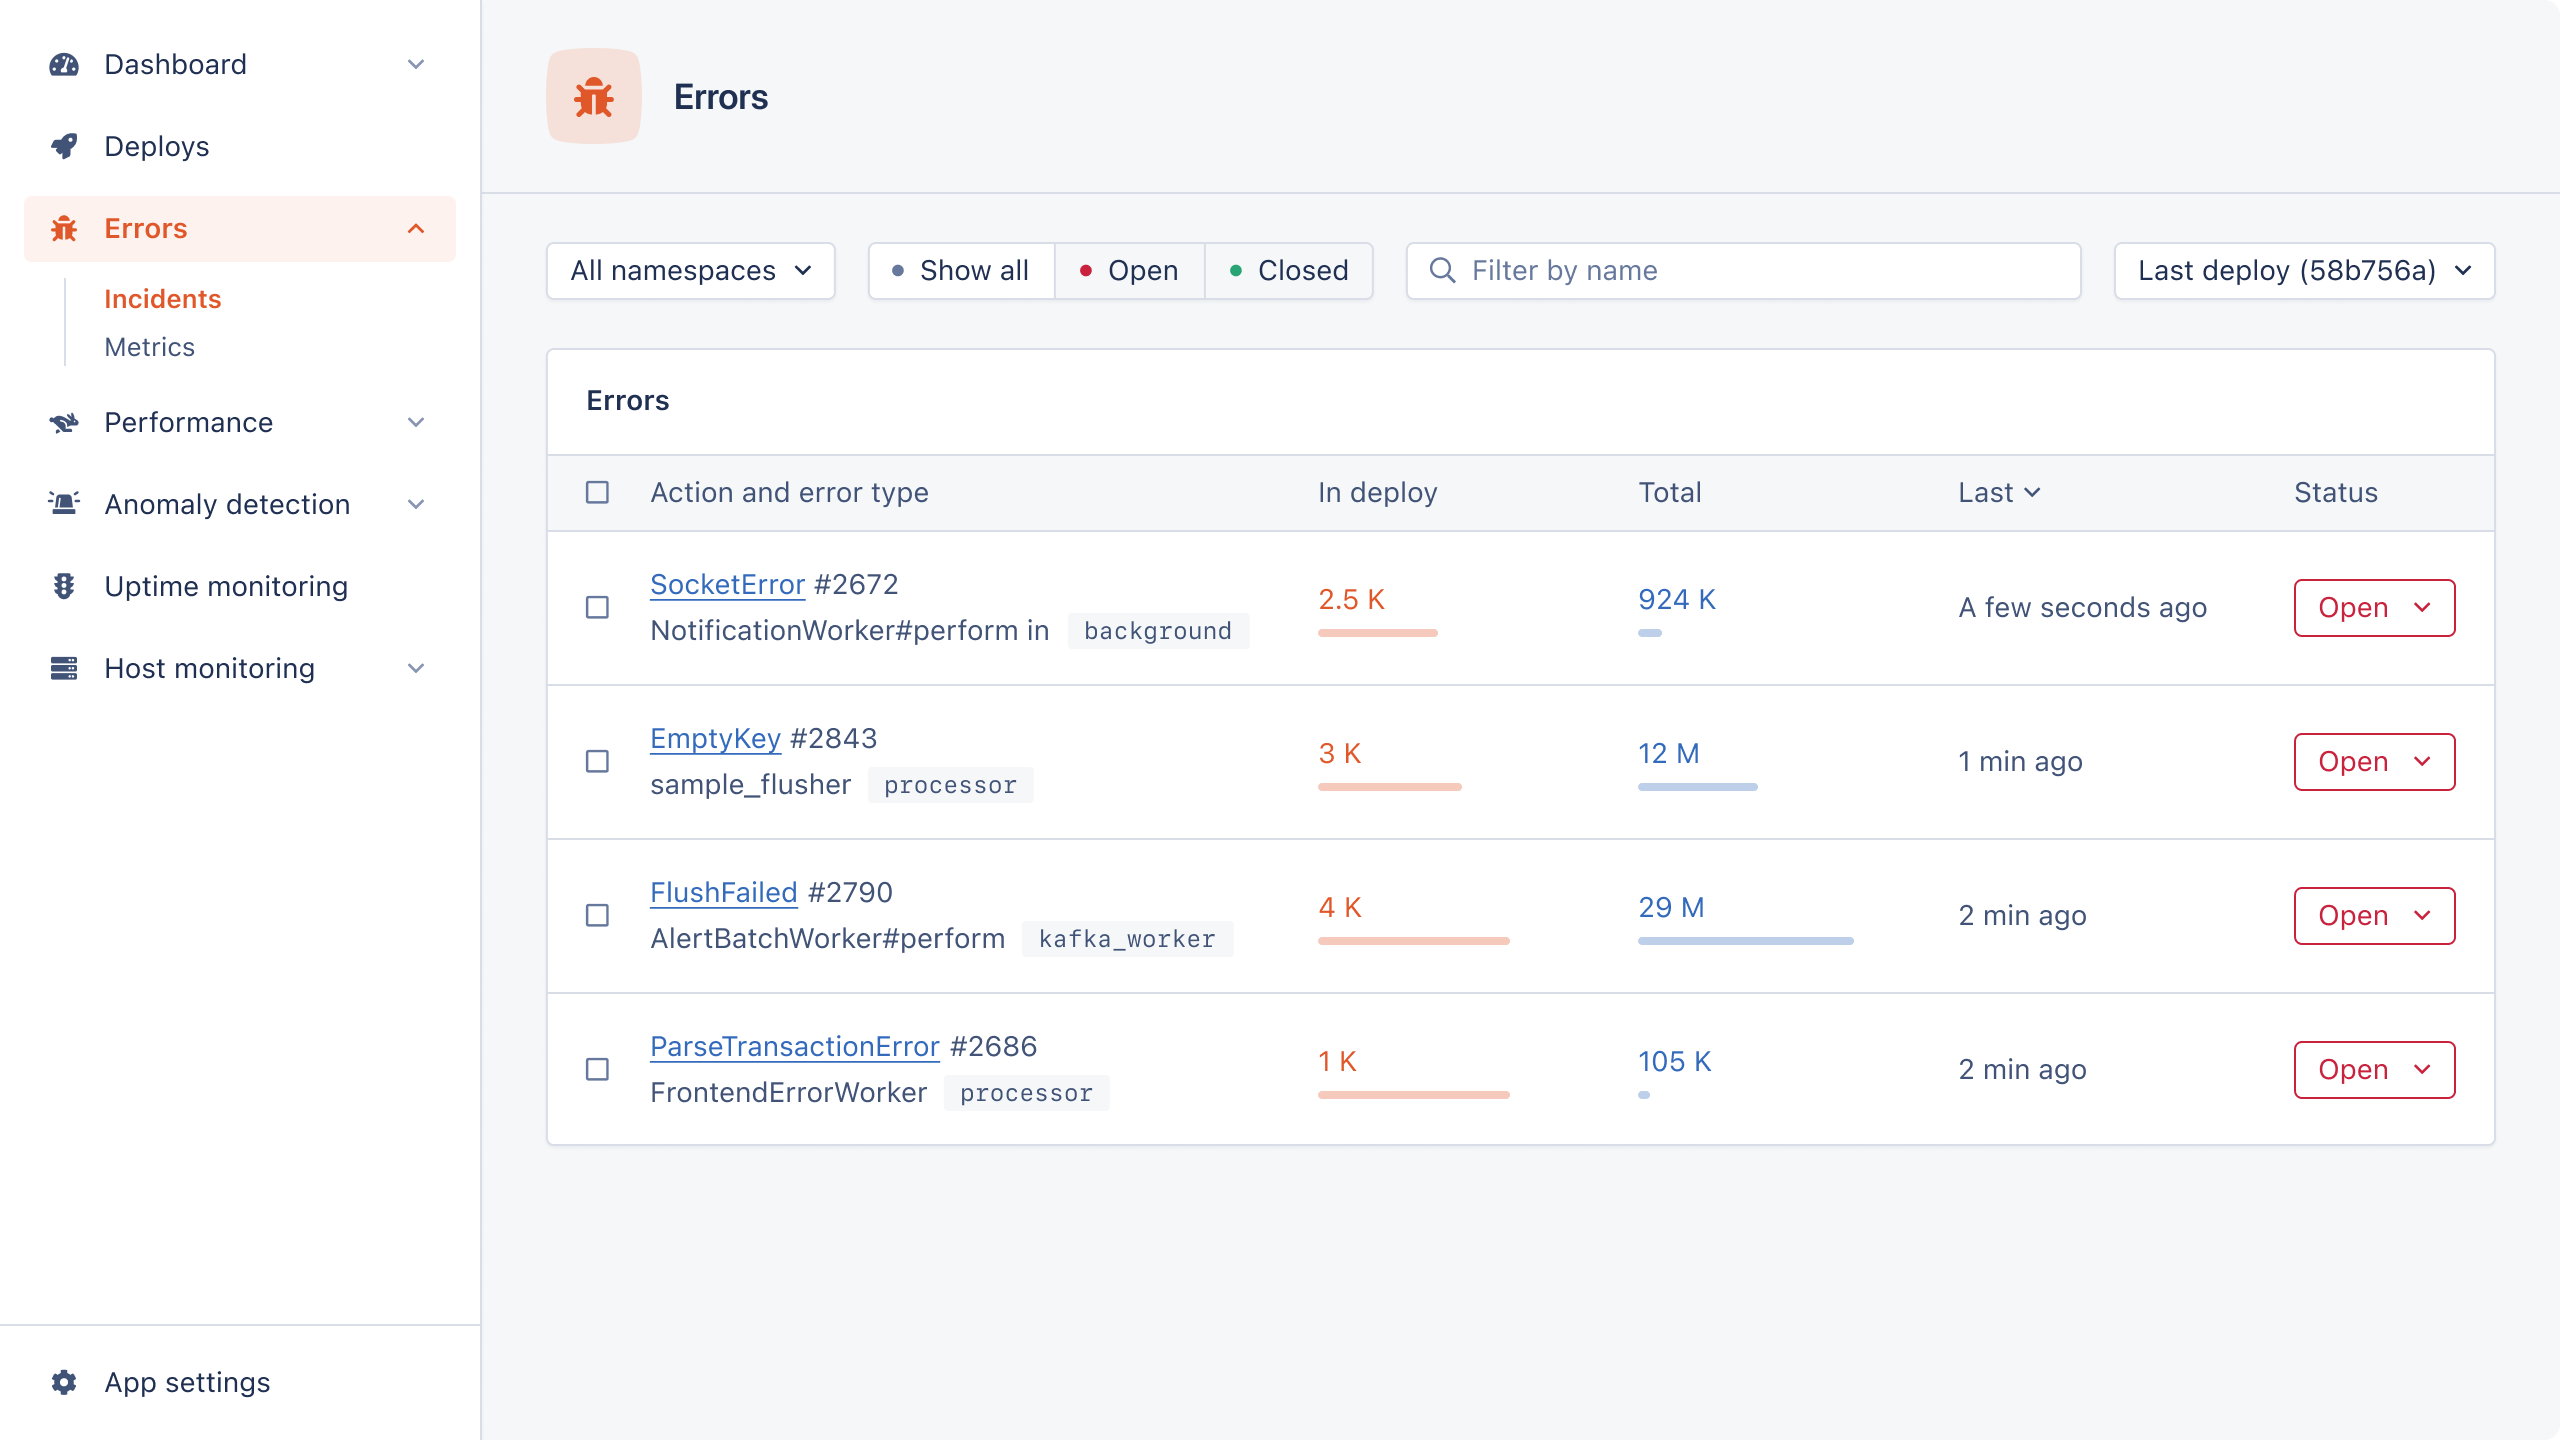
Now we're all set. Slow queries will start appearing on our AppSignal dashboard:
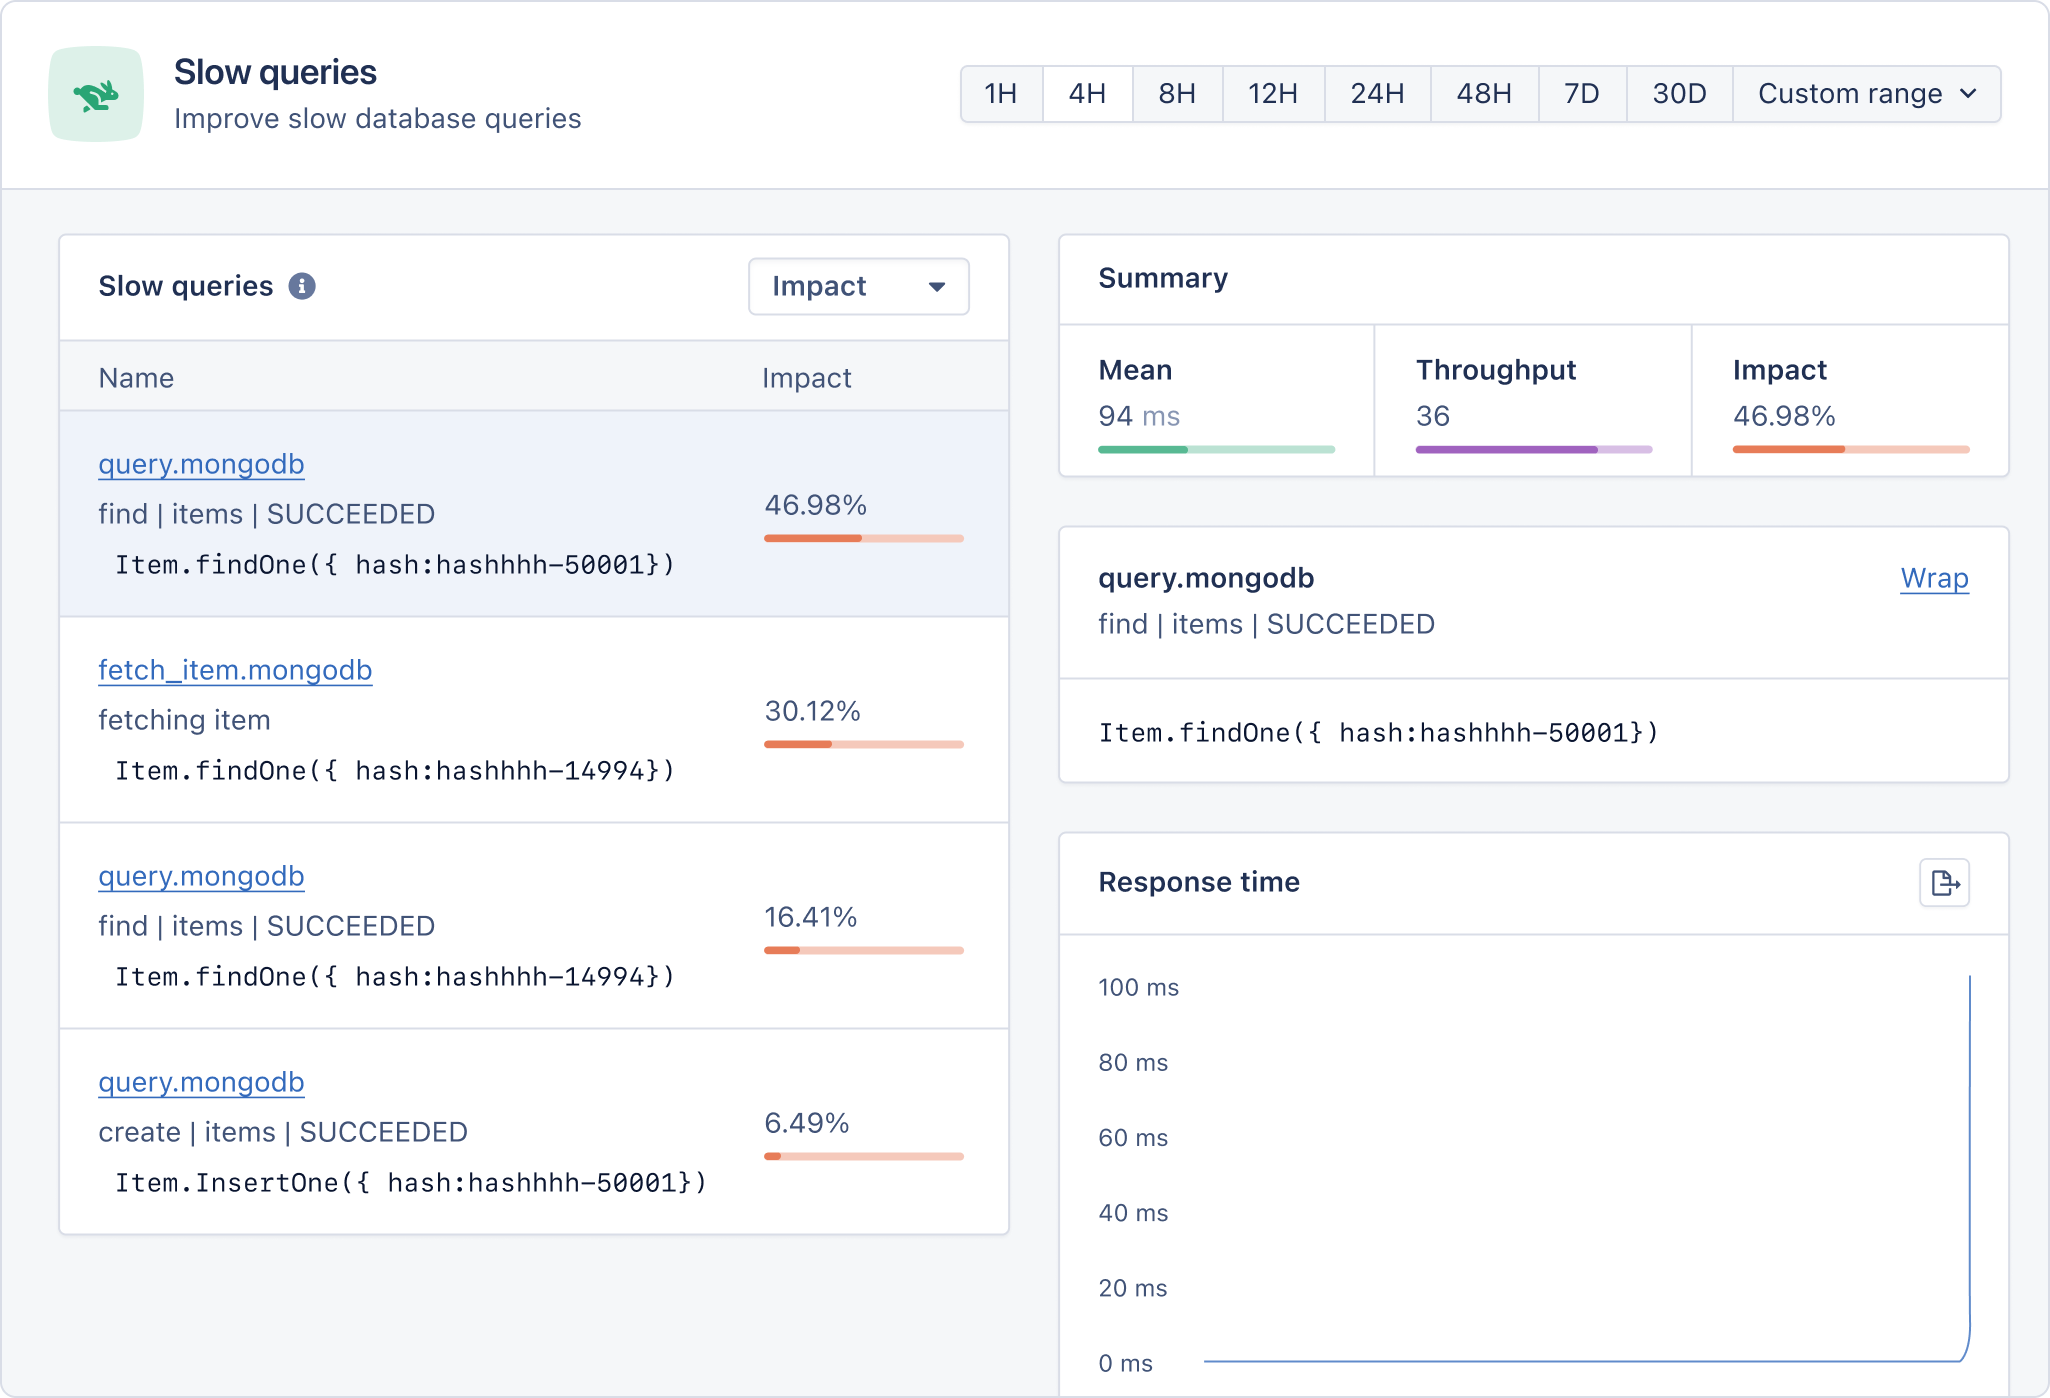
With the help of the above stats, it's much easier to pinpoint the root cause and fix it.
Managing Indexes
Not indexing generally doesn't cause a bottleneck — over-indexing does. While you should ensure all necessary fields are indexed, you should also review indexes periodically.
Scattered data can result in index fragmentation, which, in turn, negatively impacts your query performance. I'd suggest re-indexing your collections during scheduled maintenance to ensure they are always up-to-date. Here's how:
db.itemsCollection.reIndex();
You can analyze your queries using explain to understand your query in-depth and add/update the corresponding index appropriately:
db.itemsCollection.find({ price: { $gt: 10 }}).explain("executionStats")
Don't hesitate to remove indexes that are stale and not frequently used. The cost of building an index should not scare you into running suboptimal queries.
In the next section, we'll dive into how best to limit query output.
Limiting Query Output
While ignoring query output for a database with a small dataset might not hurt, limiting query output becomes essential for a bigger dataset. Showing a million results on a single list is not only unproductive, it may even crash the UI. Performing searches or operating filters becomes a nightmare.
It is completely up to you and your team to decide when to implement pagination. While everyone starts with a small dataset, the question is: do you want to control the beast now or live in the present?
Putting a limit on your MongoDB queries is simple, yet has a big impact:
db.items.find({}).limit(10);
Now, let's see how we can specify the fields we want to see in our output.
Using Projection in MongoDB
Common data fetching methods in MongoDB like find() and findOne() allow you to specify the fields you want in the output. This is called projection, and you can specify the fields you want like this:
db.items.find({}, { name: 1 }).limit(10);
This way, only the names of all ten items will be returned by the query. Alternatively, you can do negative projection, i.e., specify the fields you do not want in the output. For instance, you can remove _id from the output like this:
db.items.find({}, { _id: 0}).limit(10);
Projection is also available in the MongoDB aggregation pipeline. You can add the project stage in your pipeline like this:
db.collection.aggregate([
  {
    "$project": {
      rating: {
        "$round": "$rating"
      },
      "_id": 0
    }
  }
])
Try it out yourself in the Mongo playground.
Now we'll turn to using Mongoose for pooling connections.
Connection Pooling with Mongoose
Pooling database connections helps skip the cold start problem of setting up a standalone connection every time. You specify the number of pooled connections and pick an already established connection from the pool of idle connections whenever you need it.
Using a connection pool is an easy performance improvement, not only for databases but when making network calls as well. For example, Axios provides connection pool support out of the box.
With Mongoose, creating a connection pool is simple:
mongoose.createConnection(uri, { maxPoolSize: 10 });
Just specify the maxPoolSize in the options object, and you're done. But, you might ask, what's the upper limit? There isn't a formal one, not that I could find. But increasing your maxPoolSize to 10k might not be a good idea.
With more connections, you're spreading your resources thin, and connections are practically useless since allocated resources can't perform any operations (e.g., insufficient RAM causes sort to fail or perform slowly).
Moving on: let's see how batch operations can improve performance in MongoDB.
Batch Operations
To perform write operations on every request, a dedicated network round trip is involved. Your database takes a hit when you have thousands of such requests (bursty traffic patterns).
Batching write operations helps you avoid those redundant network round trips and, therefore, increases throughput and performance. Let's take a look at an example using bulkWrite() from the MongoDB documentation:
const { MongoClient } = require("mongodb");

// Replace the uri string with your MongoDB deployment's connection string.
const uri = "<connection string uri>";

const client = new MongoClient(uri);

async function run() {
  try {
    const database = client.db("sample_mflix");
    const theaters = database.collection("theaters");

    const result = await theaters.bulkWrite([
      {
        insertOne: {
          document: {
            location: {
              address: {
                street1: "3 Main St.",
                city: "Anchorage",
                state: "AK",
                zipcode: "99501",
              },
            },
          },
        },
      },
      {
        insertOne: {
          document: {
            location: {
              address: {
                street1: "75 Penn Plaza",
                city: "New York",
                state: "NY",
                zipcode: "10001",
              },
            },
          },
        },
      },
      {
        updateMany: {
          filter: { "location.address.zipcode": "44011" },
          update: { $set: { is_in_ohio: true } },
          upsert: true,
        },
      },
      {
        deleteOne: { filter: { "location.address.street1": "221b Baker St" } },
      },
    ]);

    console.log(result);
  } finally {
    await client.close();
  }
}
run().catch(console.dir);
Just like the aggregation pipeline, you can pass various operations to the bulkWrite method. MongoDB performs each of the operations sequentially and doesn't perform the remaining operations in case any operation fails (by default). However, you can override this behavior by passing the ordered: false option to the bulkWrite method.
Now onto soft deletes.
Soft Deletes
There are a couple of benefits to soft deletes. Permanent deletion makes it hard to recover from incidents if a rollback is required. This might not be an issue if you have backups or an audit trail that allows for point-in-time recovery (PITR). But recovery is not always possible due to cascading dependencies. However, restoring data in the case of a soft delete is as simple as flipping the is_deleted flag in the affected documents.
But as always, there's a trade-off. To implement soft delete, your collections need to have a is_deleted boolean field to indicate the state of the document. And it's easy to forget to add this condition (is_deleted: false) when you write a query.
To ensure your database size is not taken up by deleted documents, you can run a scheduled cleanup script to remove the documents (where is_deleted is true) from all of your collections.
Hard deletes leave their legacy in unpleasant ways, and recovery is not always possible. Here's the stardust we can learn from.
Next up, we'll take a quick look at caching.
Caching Layer for Faster Access
I'm sure we've all used caching at some point in our development endeavors, and rightfully so. We do not want to hit the database on every request. The biggest challenge of caching is invalidation. When you invalidate a cache can make all the difference. It's not about being 100% consistent: a little bit of inconsistency is also fine sometimes.
Whenever you design a caching layer, always keep the use case at the forefront. It'll often help you decide how to deal with invalidation. And if you're using a multi-threading environment, be mindful of false sharing.
You can use Redis to perform application-level caching — it even allows for a distributed cache. I'd recommend reading how the Redlock algorithm works.
Finally, we'll wrap up by exploring some aggregation best practices for MongoDB.
Aggregation Best Practices in MongoDB
If you've used aggregations in MongoDB, you know their importance. Aggregation pipelines help you get custom insights out of your data without manipulating data manually (which gets ugly and error-prone).
Building a performant aggregation pipeline is important, otherwise it's very likely to bring the whole database down. Just imagine doing a find operation without any filters.
There are a few things to keep in mind when building a MongoDB aggregation pipeline:
- Try to reduce the sample space as early as possible in the aggregation pipeline (ideally in the first stage). This is because the output of a stage is passed onto the next stage. Reducing the sample space ensures less data is loaded onto the memory and it's easier to work with.
- If you can, avoid
allowDiskUsewhile using the group stage. Try to make sure your data is safely below memory limits. Pulling data onto a disk levies a significant performance penalty. - Be mindful of streaming vs. blocking stages in an aggregation pipeline. For example, group and sort are blocking stages: i.e., they require complete data to be available before they can start doing the work. In other words, they cannot leverage streaming, as a grouping and sorting operation requires all data to be present at once.
And that's it!
Wrapping Up
In this post, we've explored the most critical strategies available to optimize MongoDB performance. Irrespective of the use case, these strategies will ensure your database is never a bottleneck.
But there's one thing to remember: no optimization can cure bad schema design. Doing things well at the beginning saves you a lot of time down the road.
Happy coding!
P.S. If you liked this post, subscribe to our JavaScript Sorcery list for a monthly deep dive into more magical JavaScript tips and tricks.
P.P.S. If you need an APM for your Node.js app, go and check out the AppSignal APM for Node.js.