
Fastify is a cutting-edge web framework for Node.js that offers exceptional speed and efficiency. With its extensible plugin system, support for asynchronous programming, and focus on minimalism, it is an ideal choice for backend developers developing Node.js applications.
But even the most performant web applications can encounter issues that are difficult to debug without the proper tools in place.
We will explore how to use AppSignal for a Fastify application. By the end of this article, you'll be well-equipped to harness the potential of Fastify, using AppSignal to quickly fix bugs and identify performance bottlenecks.
Let's get going!
Getting Started with Fastify and AppSignal
Before we dive into the installation, ensure you have Node installed and a code editor of your preference. Ideally, you should be running the latest LTS of Node (which is v18 at the time of writing), but if you're stuck on an earlier version, the minimum requirement is v10.
In your terminal, move to a new directory, start a new project, and add Fastify as a dependency:
cd my_project
npm init -y
npm install fastify
Now, you can add the code to set up a very simple server. This has two routes, one that returns a response and one that throws an error. I've called mine app.js:
const fastify = require("fastify")({
  logger: true,
});

fastify.get("/", async (request, reply) => {
  return { hello: "me" };
});

fastify.get("/error", async () => {
  throw new Error("This is a test error.");
});

fastify.listen({ port: 3000 }, function (err, address) {
  if (err) {
    fastify.log.error(err);
    process.exit(1);
  }
  console.log(`Server is now listening on ${address}`);
});
This can be run by using Node directly with node app.js or updating your package.json. We'll do that in a moment, so hold off there!
It's time to set up your AppSignal account. Navigate to the AppSignal website and click on Start free trial. Here, you can sign up with a username and password or by linking AppSignal to your GitHub account. You don't need to provide any credit card details while trying out the service.
Once you've signed up and logged in, you'll be brought to the dashboard. Click on the Add app button on the top right, select Node.js, and follow the instructions.
First, we'll run npx @appsignal/cli install from our project's directory. This will use the CLI tool to download and configure the AppSignal dependencies.
During the installation, you'll be asked for a push api key, which you'll see listed in step 2 of the instructions. Paste that into the terminal when asked, and then name your app. Finally, save the options in a configuration file and allow the installation to finish.
When it's finished installing, the CLI will print the run command to the terminal. Now we can update our package.json with this line in the scripts block:
"start": "node --require './appsignal.cjs' app.js"
Back in the terminal, we can start up our server with AppSignal by running npm run start.
Integrating Fastify with AppSignal
Excitingly, if we're going for a normal instrumentation of our Node application, we've already finished! Fastify is one of many integrations that are fully configured by the CLI tool we used above.
With the Fastify integration, AppSignal receives a child span representing the execution time of each component involved during a web request. This feature provides valuable insights into the performance of individual components, helping developers identify potential bottlenecks or areas that require optimization.
The integration utilizes the request route as the action name, allowing for easy identification and organization of actions within the monitoring dashboard. Moreover, query parameters and request body data are set as span attributes, offering a comprehensive view of the request details, which can prove essential in understanding the context of each action.
One of the key benefits of integrating Fastify with AppSignal is automatic error tracking. This feature ensures that developers are promptly notified of any issues that arise within their application, allowing them to address problems quickly and maintain their web application's overall reliability and user experience.
Let's trigger a few routes on the API we created above and explore this within AppSignal. So, either using an API client (like Postman or Insomnia) or your web browser, trigger the following routes:
- http://localhost:3000/
- http://localhost:3000/error
- http://localhost:3000/not-here
- http://localhost:3000/not-here?test=here
On the AppSignal dashboard page, select Overview on the left-hand menu.
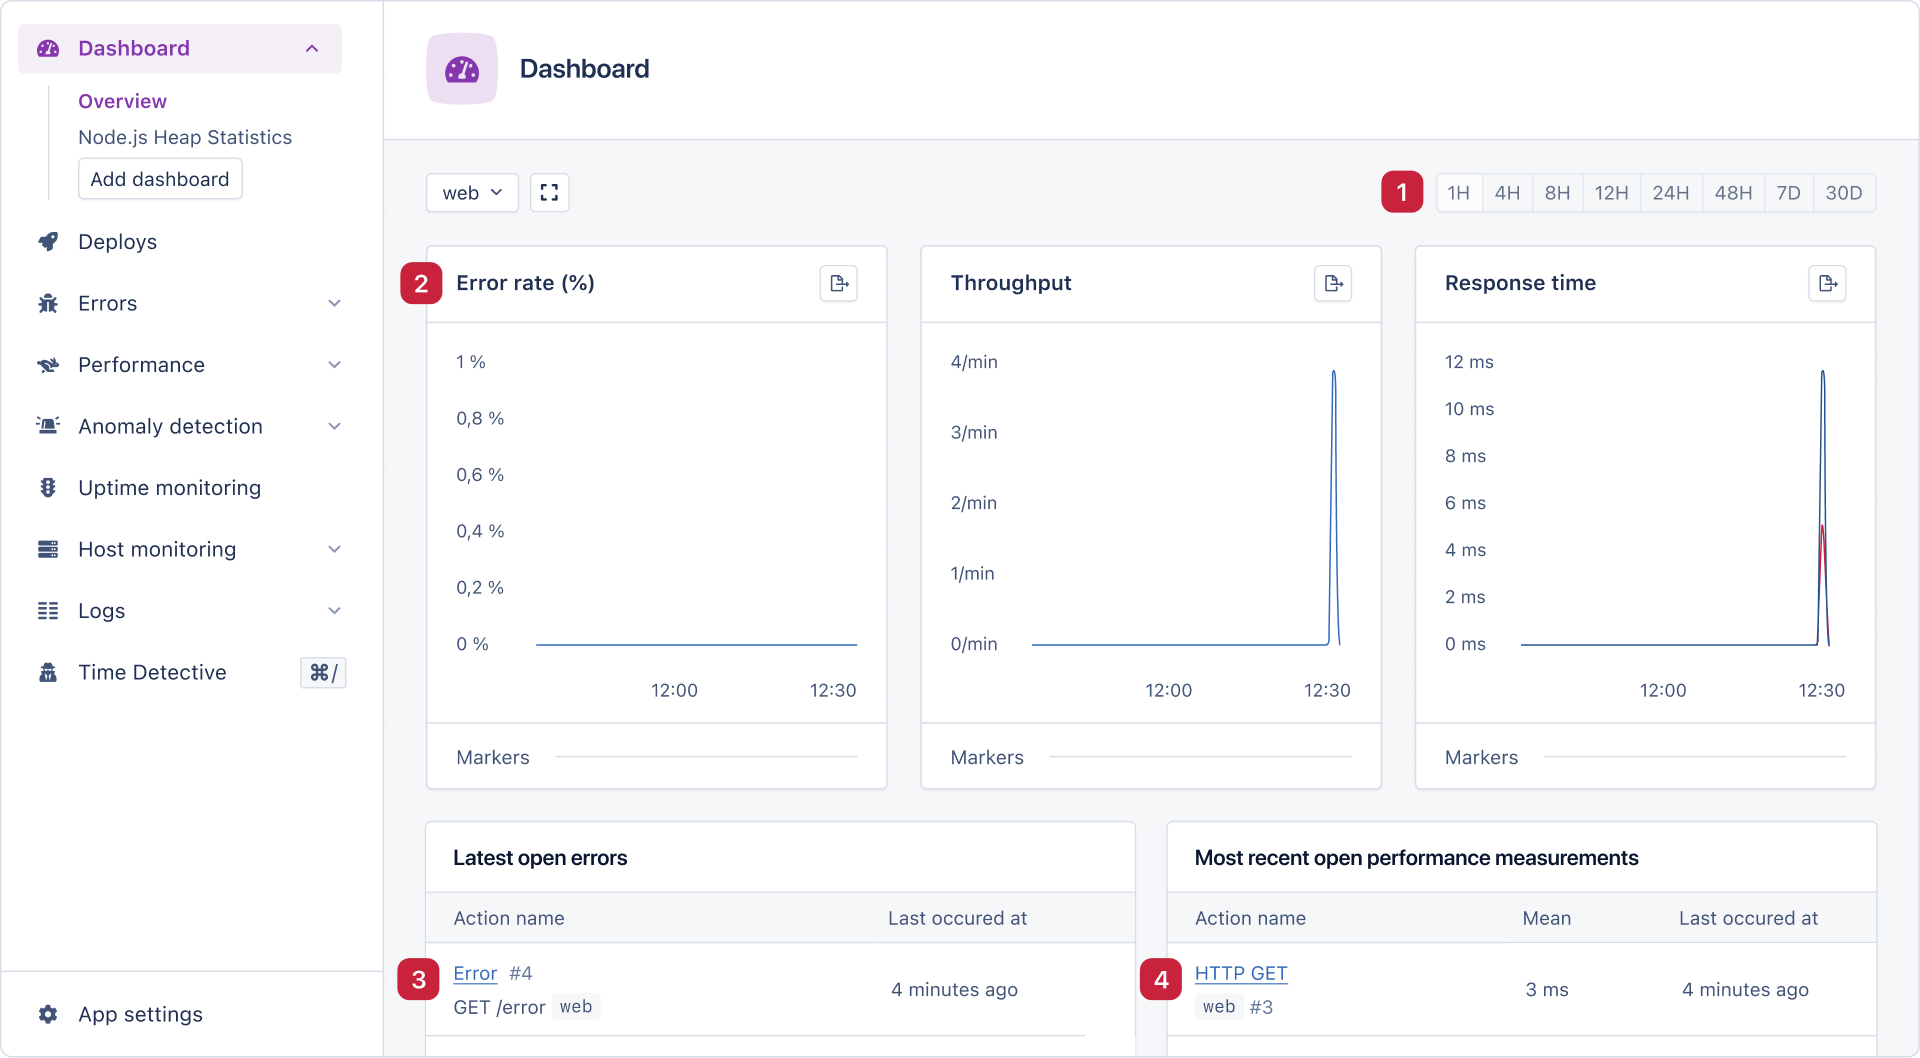
- In this menu, we can decide what time period to zoom in or out to. This can help us focus on a particular time period or get a birds-eye view of how an application is performing in the long term.
- These three graphs draw attention to the most important metrics to monitor. Having them front and center on the dashboard allows you to keep them top of mind.
- Here, we have the latest open errors — we'll zoom into this in a moment.
- Lastly, we have the latest performance measurements. Again, we'll zoom in there soon.
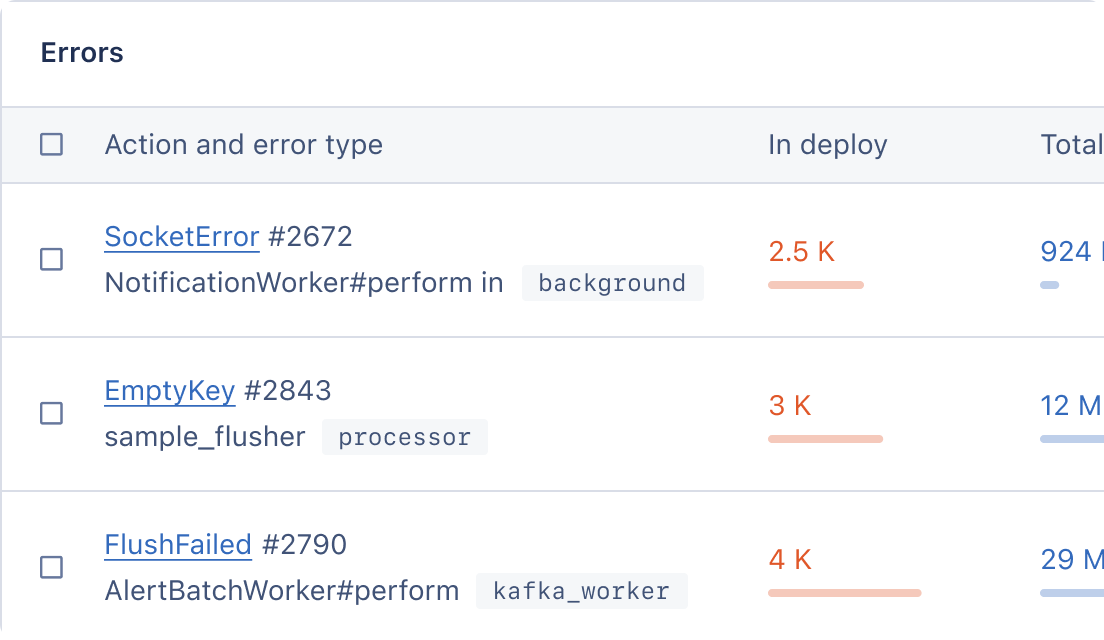
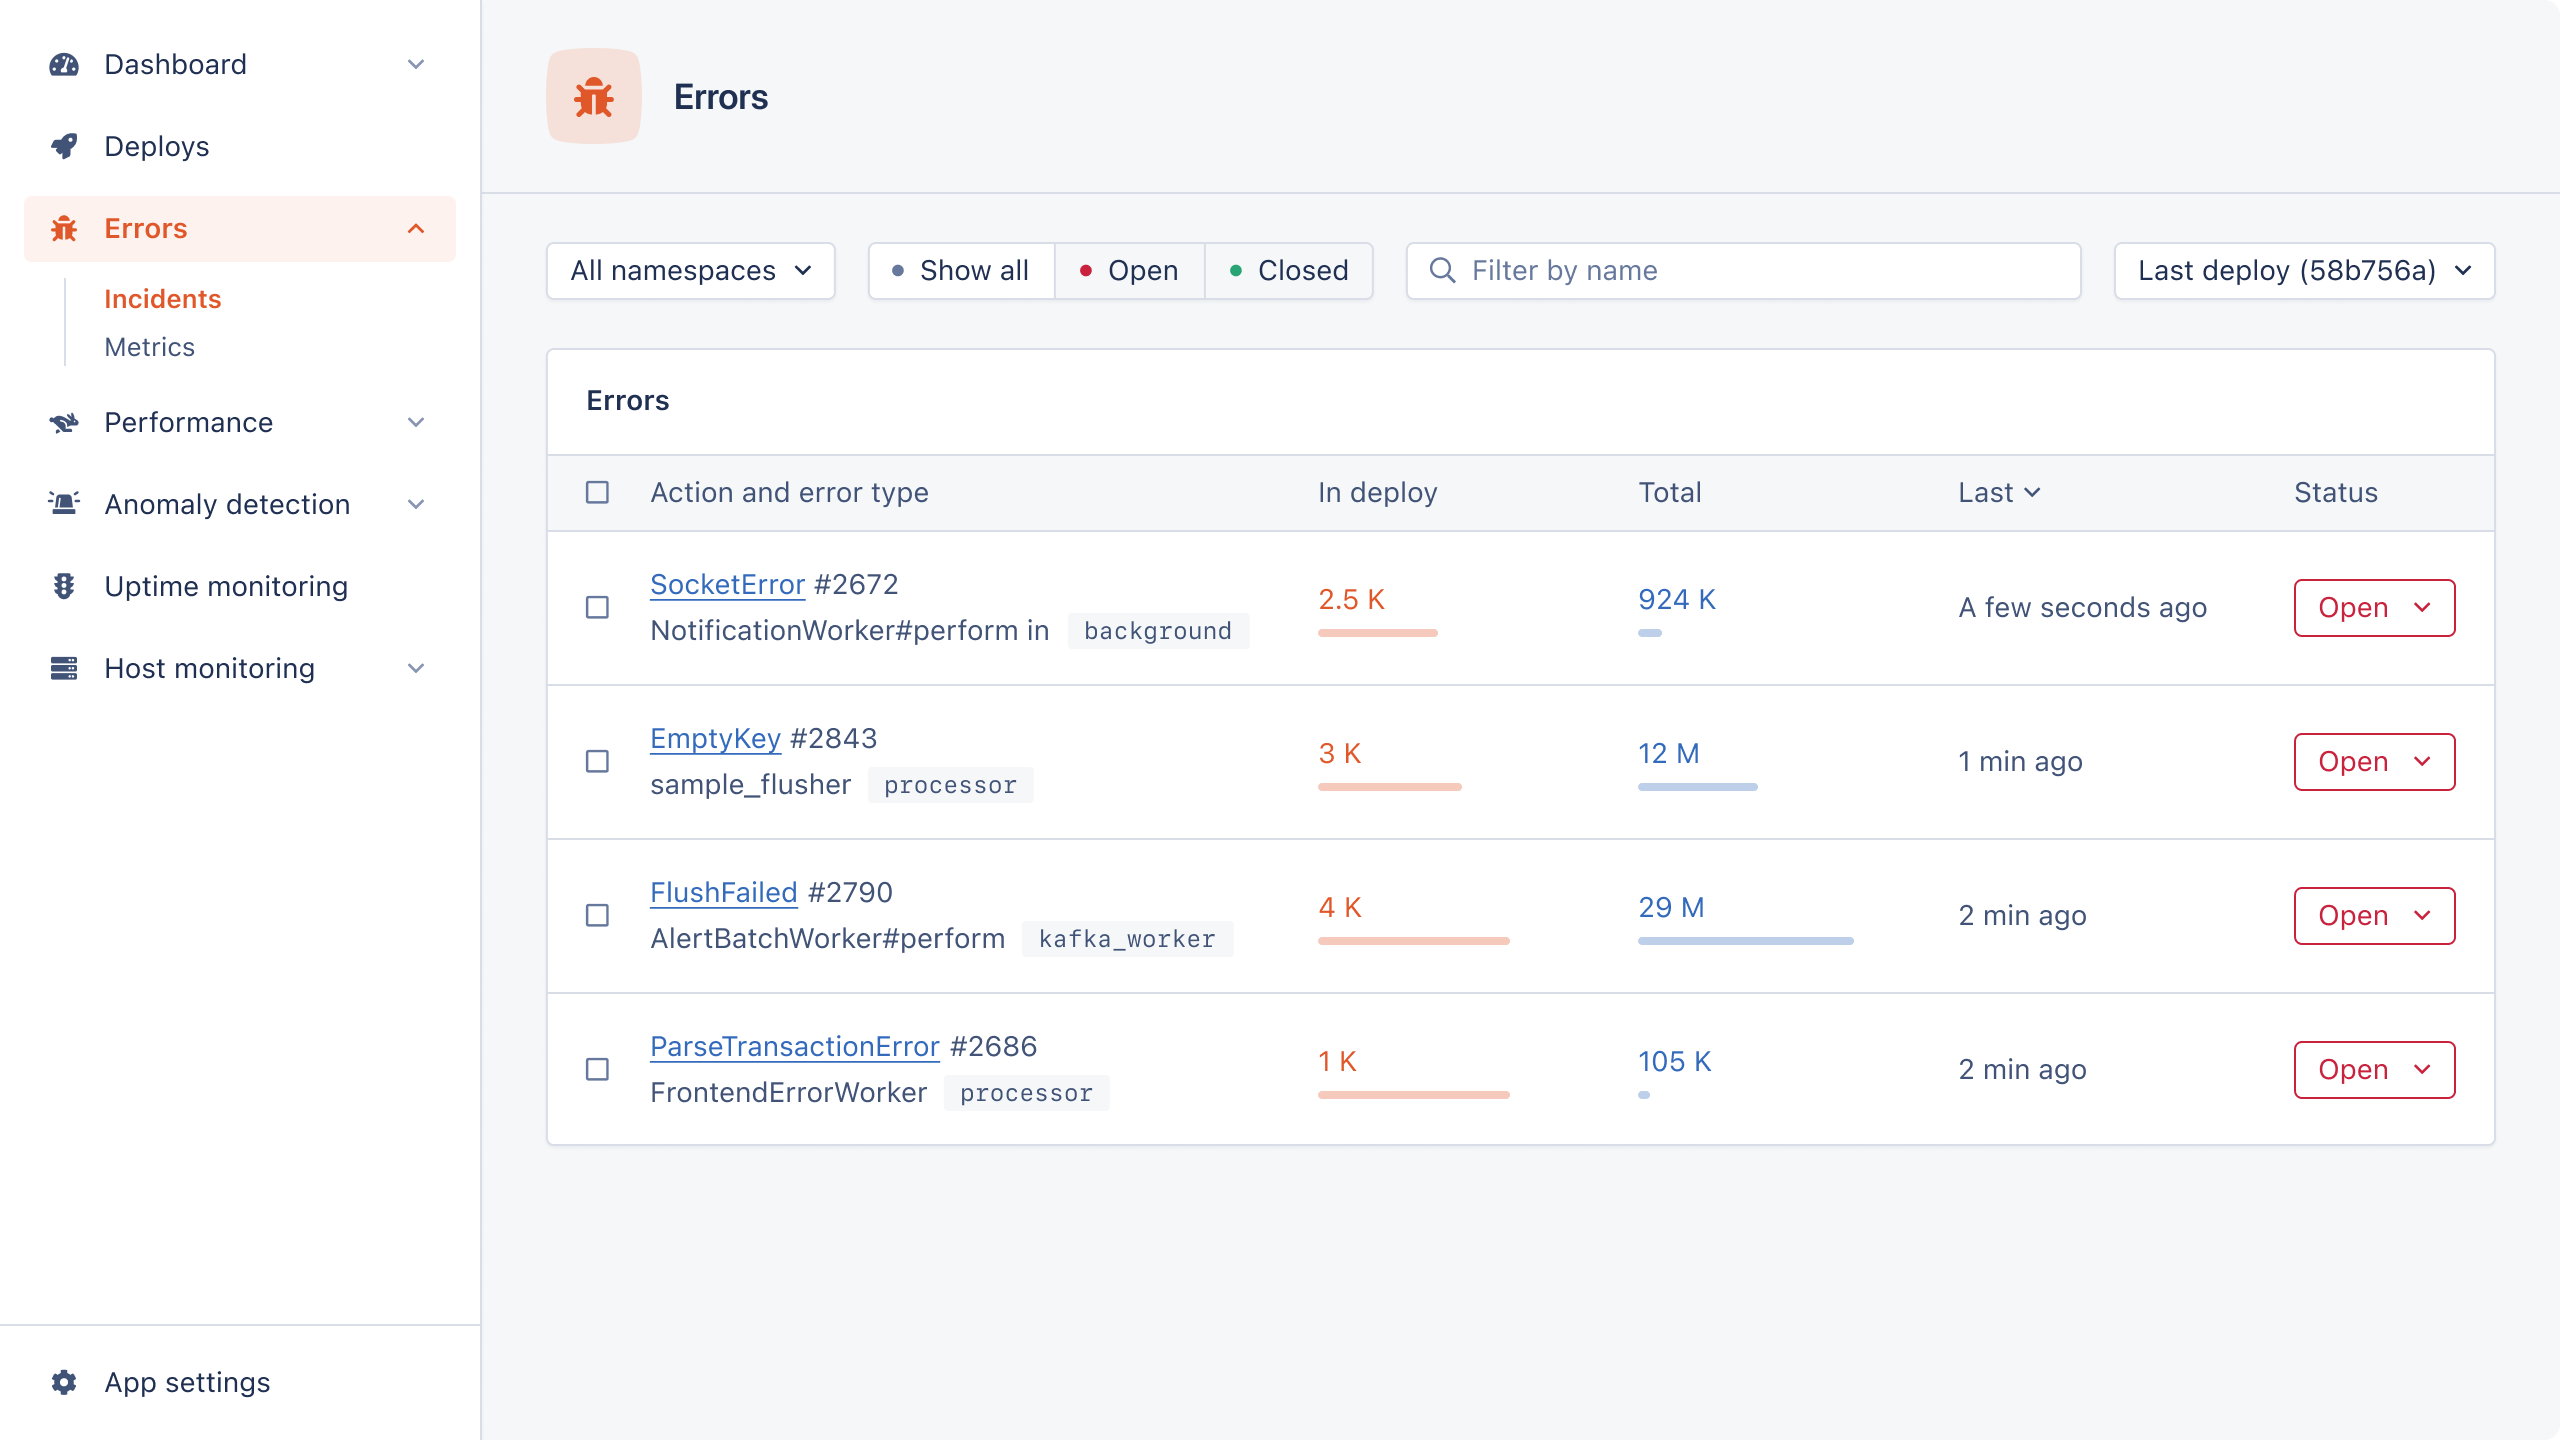
Grouping Fastify Errors with AppSignal
AppSignal does a great job of grouping errors of the same type. This stops potential issues being hidden in a live stream of data. We can also collaborate with team members to investigate issues in our application.
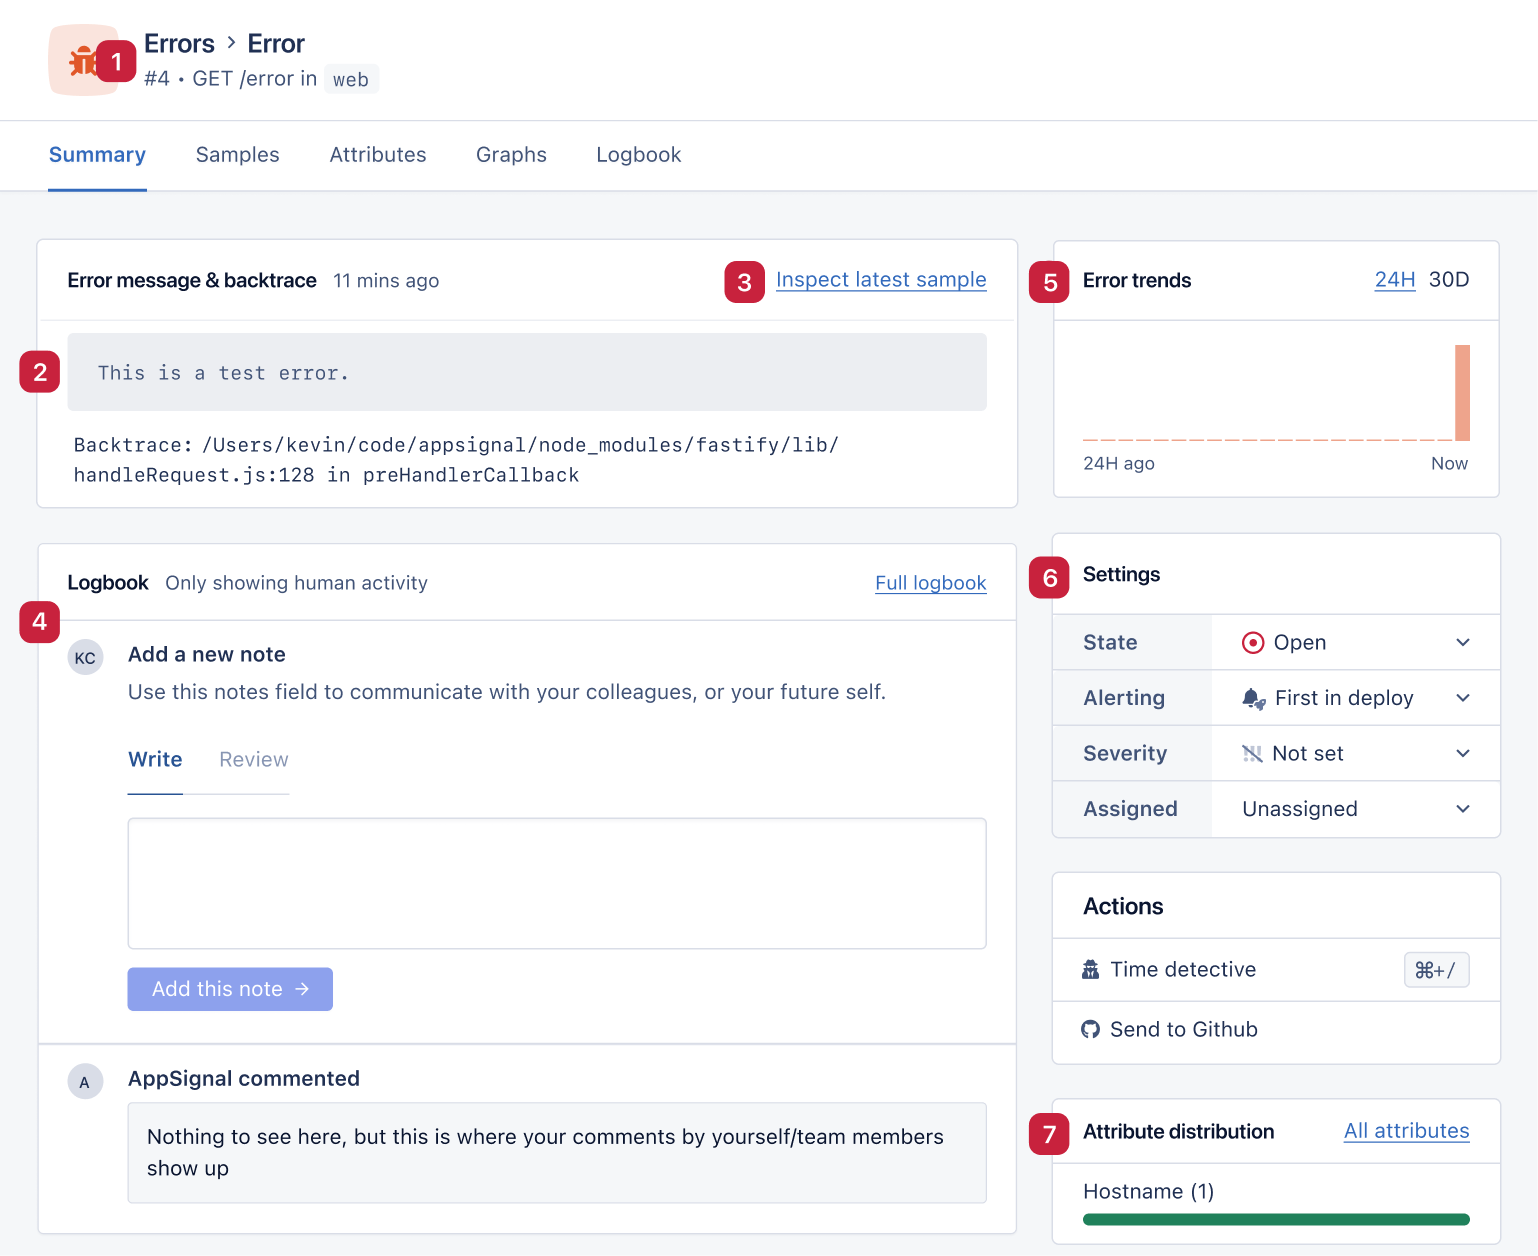
This is the error summary page, and a lot is going on here.
- First, we have the HTTP method and route where this error has been triggered. All of the automated logging is identified in this way, allowing AppSignal to group the errors more reasonably.
- Next, we have the error message raised by the application and the end of the backtrace. This is the summary page, so we don't get a full stack trace.
- We can click on
Inspect latest sampleto see a full request/response cycle for a more targeted investigation. - A logbook here allows you to record what you've tried and excluded. This kind of shared notebook reduces the chances of multiple colleagues wasting time on the same approach.
- We can see if there is a trend for this error over the past day or 30 days.
- In the settings panel, we can assign this error and decide when we should alert colleagues. This is an excellent triaging mechanism, allowing teams to focus their energies on open and important issues.
- Lastly, any similar attributes between these requests are gathered and displayed here.
There are other tabs along the top. You can explore these yourself, but I'll draw your attention to the Samples tab in particular.
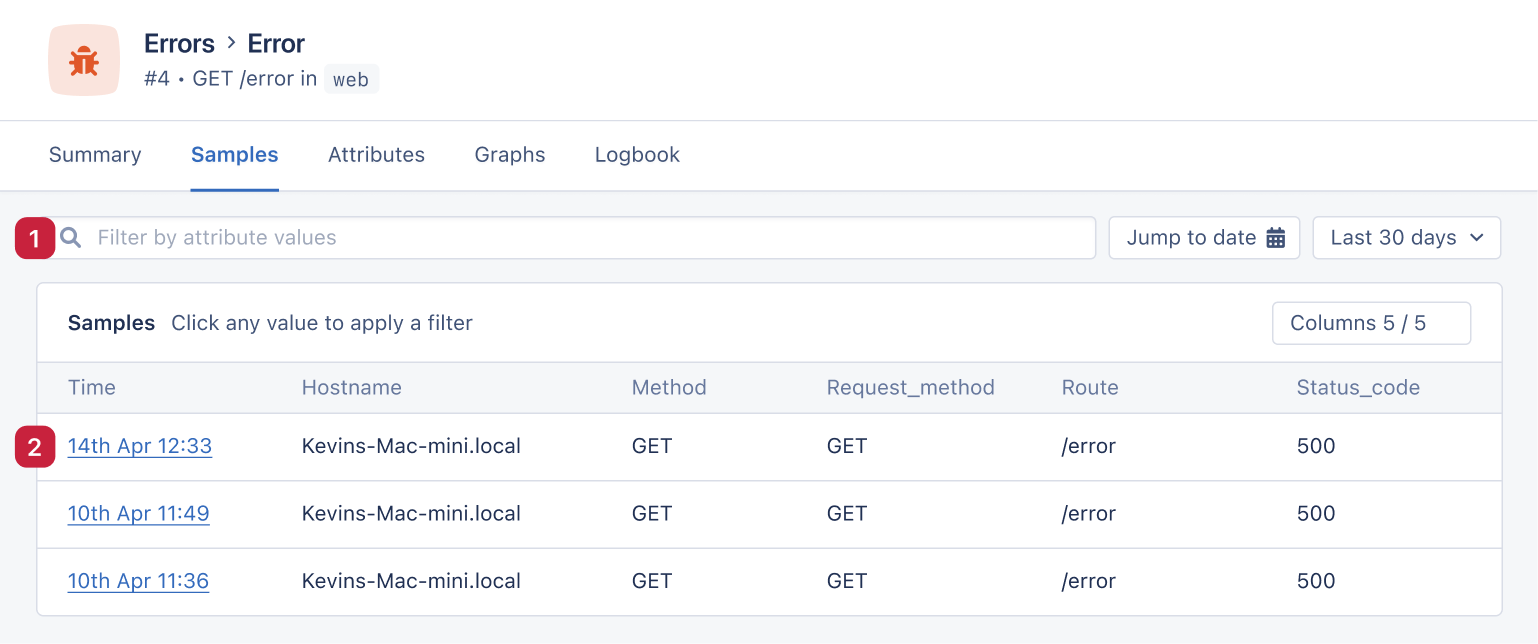
This allows us to filter results based on attributes and click through for details of any requests that have triggered this error.
Route Performance in Fastify
We can see that when our application throws an error, this will be tracked effectively. But what about identifying performance-based issues?
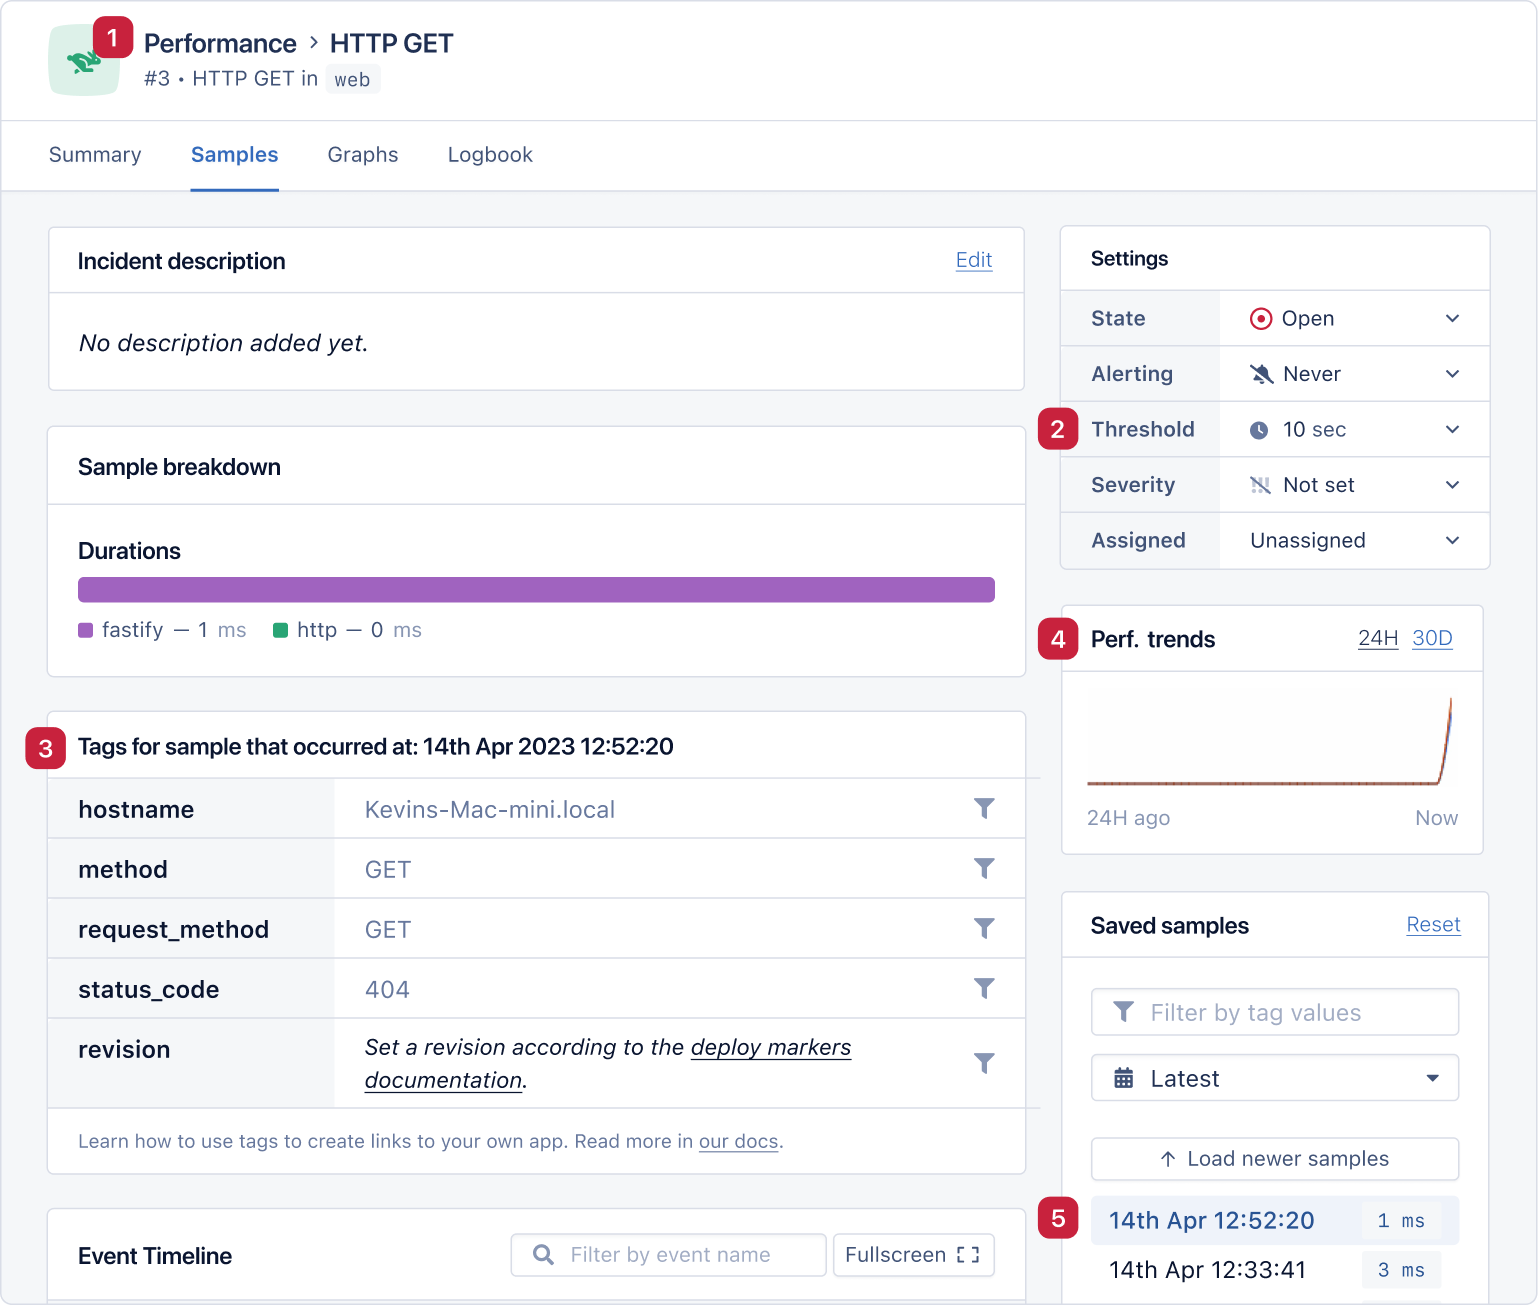
This is the latest sample when analyzing the GET requests from our API.
- We've got a clear description of the types of requests grouped together to make these samples.
- Here we can set the warning level. It defaults to 10 seconds. So if your API takes more than 10 seconds to respond, AppSignal will send an alert. You can lower this threshold to 200ms or raise it to around 60 minutes, depending on your needs.
- Here we have a description of the sample. We can see that this request results in a 404 error.
- Again, we've got a visual graph of trends, so we can quickly understand any potential drops or spikes in performance.
- We can analyze other samples to compare and contrast performance by clicking between them here. Further down this page, we can find the attributes that describe this response and any parameters sent as part of the request URL.
These performance metrics are gathered based on actions. They are described by the method and the route. I'm going to set up a simple CRUD API with a MongoDB backend.
Adding a CRUD API
This tutorial assumes you have MongoDB set up on your system already. If you don't, you can head to the MongoDB website and get yourself set up.
To build the API, first add these libraries:
npm install @fastify/mongodb fastify-plugin
Then create a database connector plugin in a file called db.js:
const fastifyPlugin = require("fastify-plugin");
const fastifyMongo = require("@fastify/mongodb");

/**
 * @param {FastifyInstance} fastify
 * @param {Object} options
 */
async function dbConnector(fastify, options) {
  fastify.register(fastifyMongo, {
    url: "mongodb://localhost:27017/test_database",
  });
}

module.exports = fastifyPlugin(dbConnector);
Next, bring the routes into their own file, routes.js, and add the routes for an animal api:
/**
 * Encapsulates the routes
 * @param {FastifyInstance} fastify  Encapsulated Fastify Instance
 * @param {Object} options plugin options, refer to https://www.fastify.io/docs/latest/Reference/Plugins/#plugin-options
 */
async function routes(fastify, options) {
  const collection = fastify.mongo.db.collection("test_collection");

  fastify.get("/", async (request, reply) => {
    return { hello: "me" };
  });

  fastify.get("/error", async () => {
    throw new Error("This is a test error.");
  });

  fastify.get("/animals", async (request, reply) => {
    const result = await collection.find().toArray();
    if (result.length === 0) {
      throw new Error("No documents found.");
    }
    return result;
  });

  fastify.get("/animals/:animal", async (request, reply) => {
    const result = await collection.findOne({ animal: request.params.animal });
    if (!result) {
      throw new Error("Invalid value");
    }
    return result;
  });

  fastify.delete("/animals/:animal", async (request, reply) => {
    const result = await collection.deleteOne({
      animal: request.params.animal,
    });
    if (result.deletedCount === 0) {
      return reply
        .code(404)
        .send({ error: true, message: "This item doesn't exist" });
    }
    return reply.code(204).send("");
  });

  const animalBodyJsonSchema = {
    type: "object",
    required: ["animal"],
    properties: {
      animal: { type: "string" },
    },
  };

  const schema = {
    body: animalBodyJsonSchema,
  };

  fastify.post("/animals", { schema }, async (request, reply) => {
    // we can use the `request.body` object to get the data sent by the client
    const result = await collection.insertOne({ animal: request.body.animal });
    return result;
  });
}

module.exports = routes;
Lastly, back in app.js, import and register the plugins:
fastify.register(require("./db"));
fastify.register(require("./routes"));
Since I'm importing the routes here, I've removed the / and /error routes I registered earlier.
Using the CRUD API
Now that these routes are set up, I can query each of them. Here's a table of the available routes.
| Method | Route | Parameters | Example | Description |
|---|---|---|---|---|
| GET | / | None | Returns an object containing a hello message | |
| GET | /error | None | Throws a test error | |
| GET | /animals | None | Returns an array of all animals in the test_collection | |
| GET | /animals/:animal | animal (string, path parameter) | /animals/dog | Returns the specific animal object from the test_collection if it exists |
| DELETE | /animals/:animal | animal (string, path parameter) | /animals/dog | Deletes the specified animal from the test_collection if it exists and returns a 204 status code, otherwise returns a 404 error with a message |
| POST | /animals | animal (string, request body) | Request Body: {"animal": "dog"} | Inserts the provided animal into the test_collection and returns the result |
Back on the AppSignal Actions page, I can now see each action alongside its performance metrics:
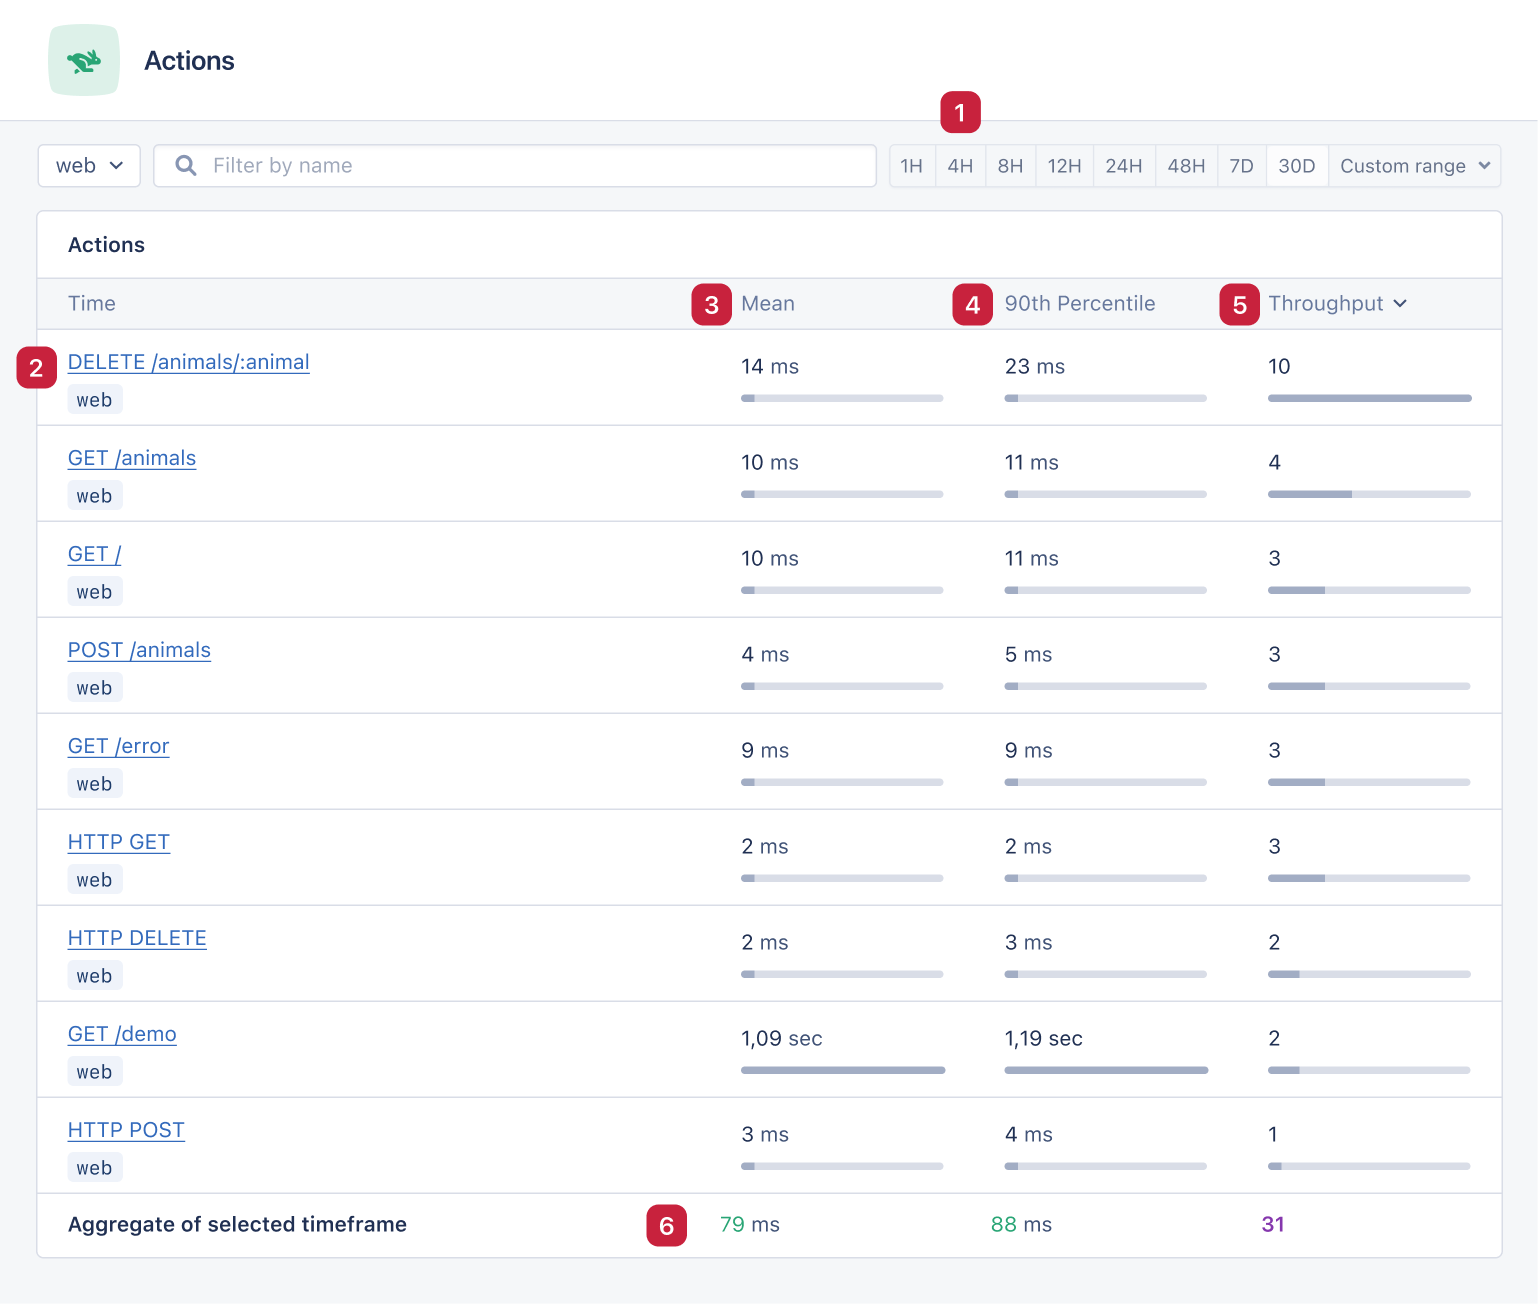
- As before, we can change the time range. We also have the
Custom range, which allows us to be forensic in our tracking. - Here is the list of actions. Clicking any of these links will take us to an action's summary page. As well as linking to any errors, we can access all of the related samples that make up this data set.
- A quick visual of the mean time it takes for each of our actions to respond. The slowest one is
/demo, a sample route provided by AppSignal. - The mean is a good measure. The 90th percentile tells us the speed at which 90% of our users receive a response. If these numbers are far apart, it might be worth investigating.
- The throughput is the total number of requests sent through the action in our chosen timeframe.
- The summary statistics at the bottom give us a decent summary of how our application is performing.
Thanks to our AppSignal integration, we don't need to add any custom instrumentation and can benefit from error and performance tracking straightaway.
Wrapping Up
Integrating Fastify with AppSignal provides a powerful combination for developers seeking to create high-performance web applications while ensuring seamless error tracking and monitoring.
Fastify's speed, efficiency, and extensibility make it an ideal choice for backend developers working with Node.js applications. Meanwhile, AppSignal's robust error tracking and performance monitoring capabilities equip developers with the insights necessary to maintain their applications' reliability and user experience.
With AppSignal, you can quickly fix bugs and identify performance bottlenecks, ensuring that your application remains in top condition. It's worth exploring the capabilities and strengths of both Fastify and AppSignal further. You can also check out our Building Node.js Applications with Fastify series to learn more about Fastify.
Happy coding!
P.S. If you liked this post, subscribe to our JavaScript Sorcery list for a monthly deep dive into more magical JavaScript tips and tricks.
P.P.S. If you need an APM for your Node.js app, go and check out the AppSignal APM for Node.js.