
As a developer supporting a growing business, you’ll likely spend a lot of time thinking about scaling. We live in a wonderful time to be solving scale problems. Computers are so fast and capable that many of the development decisions you make when writing backend systems won’t noticeably impact performance (until your app reaches an absolutely massive scale). If this weren’t the case, we’d all be writing web servers in C.
This article will explore three scaling challenges in a fictional Node.js backend system, written as user stories. While this system is fictional, these issues closely mirror ones I have seen in my career, and they may also be familiar to you.
We’ll discuss useful tools for diagnosing the root causes of scaling issues, as well as techniques for alleviating bottlenecks and eliminating points of failure.
Let's get started!
About Our System With a Node.js Backend
For my examples, I’ll discuss a system that classifies user transactions to help with personal budgeting. Customers link a payment card, and their bank or credit issuer informs our system of their purchases. Our system is a web server with an API endpoint called by the participating banks’ systems (a “webhook”), and a set of API endpoints called by consumer frontends when they wish to view their categorized transactions. The banks send between 1 and 100 transactions per request, which we parse and process.
Our server calls a third-party web API to look up merchant details which help us classify transactions into categories like “groceries”, “dining out”, and “entertainment”. These classified transactions are then written to a highly normalized relational database. Users can see updated data within 24 hours of each transaction.
Our backend is a Node.js HTTP server running on a virtual host behind an Nginx reverse proxy. The server process is configured to automatically restart if it terminates.
Without further ado, let's explore our first challenge.
Challenge 1: Issues When Logging In As a User
Scenario: As a user, I attempt to log into the mobile app between 3 and 4 pm on weekdays. I expect to see my transactions quickly, but logging in takes a very long time and often fails.
Intermittent failure is never fun to deal with; in this case, we benefit from a consistent, recurring time window.
One approach might be to jump straight to our production logs to see what the application is logging during this time window, but a common problem with timeouts is that we’ve included log statements that execute on completion of the problematic instruction. It can’t hurt to check logs, but when requests are very slow and frequently time out, it’s likely a resource is overloaded. This is why it’s a good idea to monitor key resources like the application server’s CPU and memory consumption, and key database metrics like CPU, memory, and IOPs (I/O operations per second).
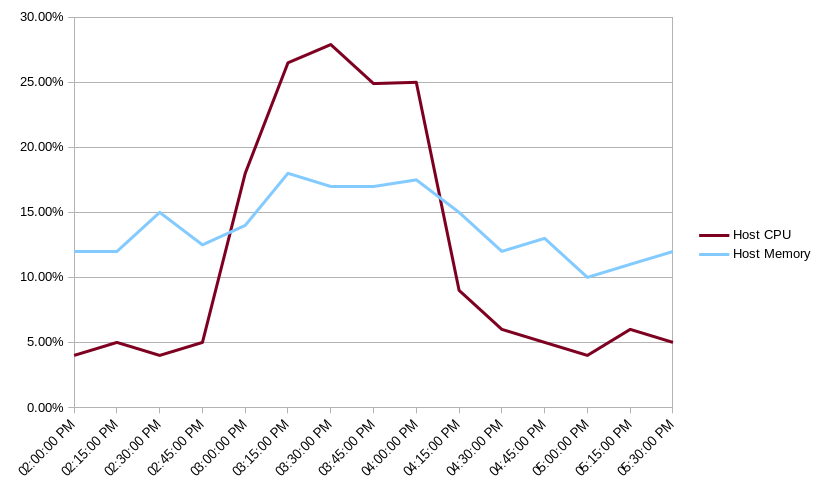
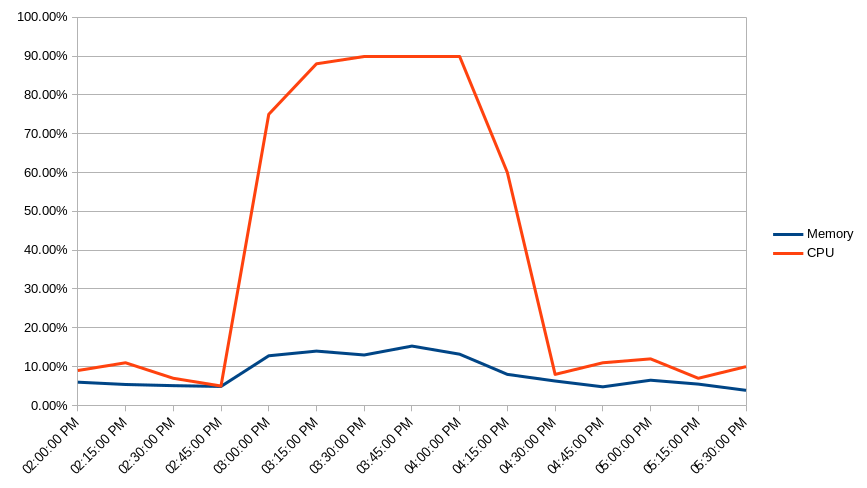
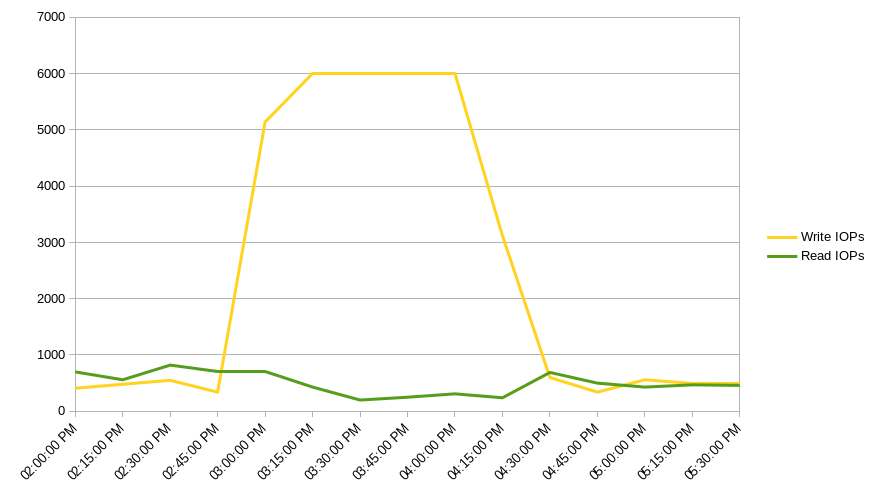
In this case, we are greeted with a moderate increase in host CPU and memory consumption during the user’s reported window of 3 to 4 pm, and a large spike in write IOPs and CPU on our database instance, as well as a small spike in memory consumption on the database host.
Side-note: Check out the Host Monitoring section of our post Monitor the Health of Your Node.js Application to see how you can use AppSignal to track some of these host metrics, including memory and CPU usage.
It's fairly obvious our application's compute resources are not under enough load to cause these time outs and slow responses. However, the spiking database write IOPs and CPU usage point to a high volume of inserts or updates slowing down the database. The fact that read IOPs remain low confirms this. There is also some evidence that the high amount of write activity is slightly slowing down reads elsewhere in the app.
Where's the Point of Failure?
So what happens when a user logs in, and how could this spike in write activity interfere with that?
First, the user's record is looked up using the email they signed in with. This should be a read based on a unique index, and there is little evidence that reads are affected significantly.
Second, the user's password is hashed and compared to the database record, using something like bcrypt.
This is certainly CPU intensive, but we know the application host is not under strain here; again, this is unlikely to
cause login to fail, even when the database server is under load.
Third, a session token is created that will be included in requests from the app. This is stored in a session table in the same relational database. The user's last-seen timestamp is also updated in the users table. The steps are suspect points of failure for these possible reasons:
- The large number of database write IOPs are slowing down all writes to the database. This is plausible, but on its own, unlikely to cause such slow queries that logins fail.
- The queries spiking the write IOPs and CPU are locking the resources used by the login, or even causing deadlocks. The somewhat inconsistent nature of the user's reported issue indicates this is a likely cause; the same queries may not always cause deadlocks or lock resources used by any given user. It largely depends on the content of the transactions themselves.
Investigating Further
To confirm or invalidate our theory, we should investigate the cause of the write IOPs and database CPU spike between 3 and 4 pm. Again, we could go to our logs for this, as ideally we are logging basic information about every request to our server.
But since we already know the database is under load at this time, and we are going to end up evaluating queries anyway, let's hope we have slow query monitoring enabled either natively in our RDBMS or inside our application performance monitoring tool and check there first.
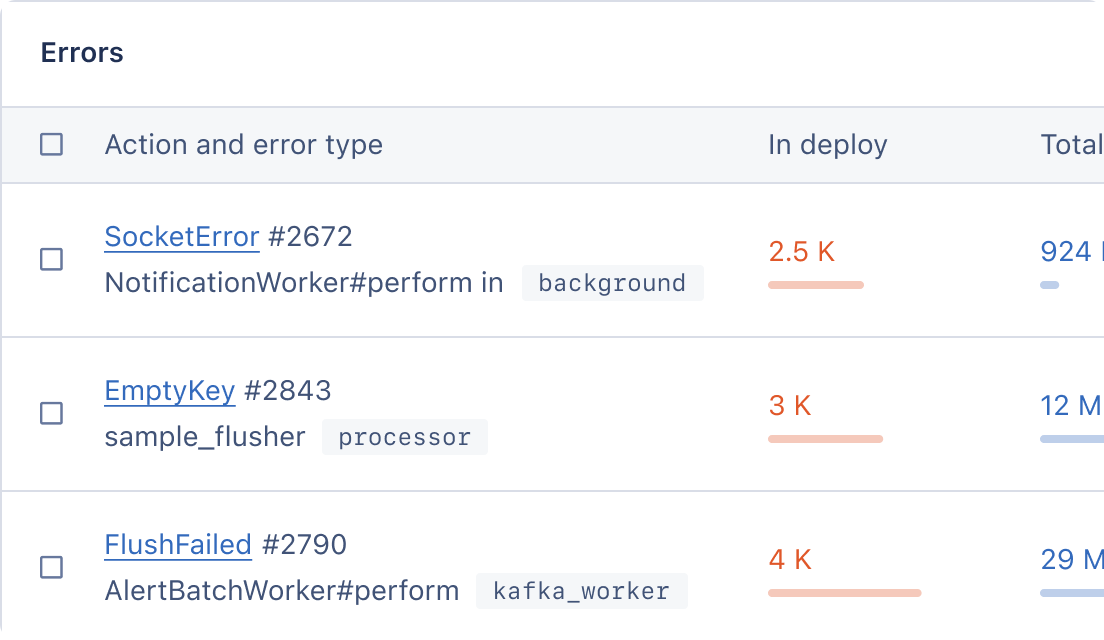
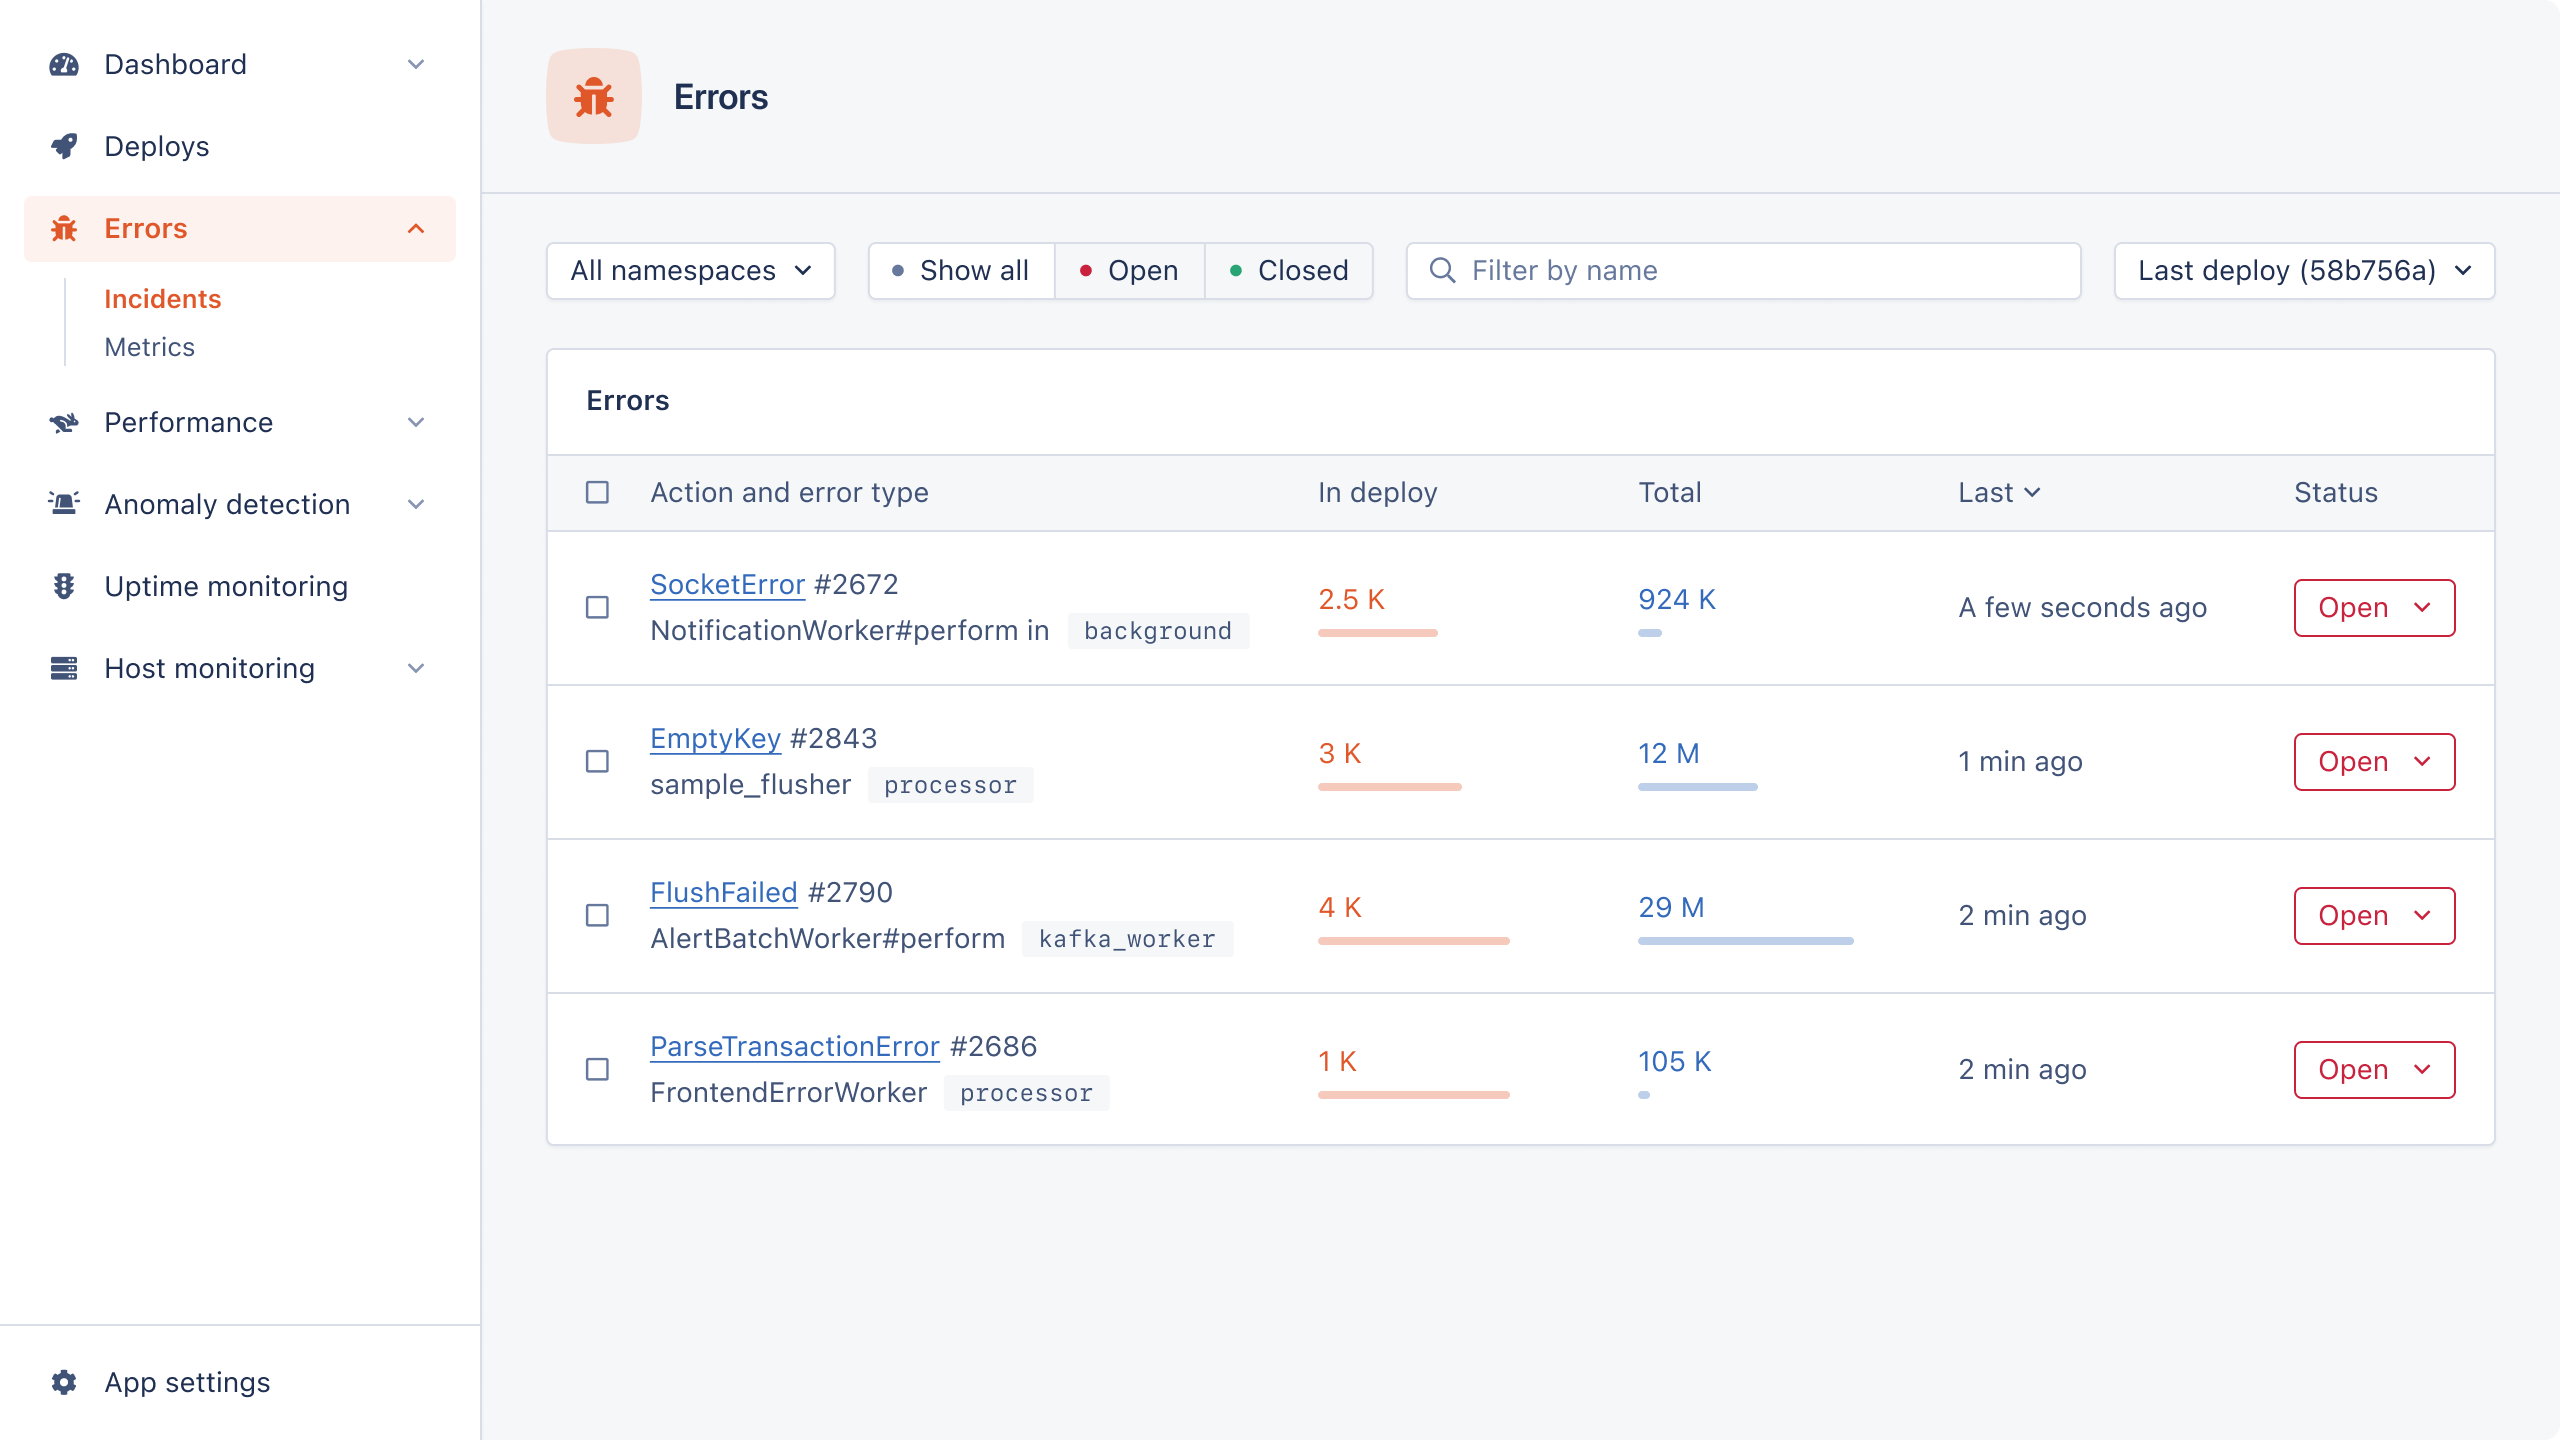
In this case, our APM allows us to sort queries by impact, and the three slowest queries are:
| Query | Impact |
|---|---|
A batch insert into the transaction table which occurs when the payment card provider calls our webhook with new transaction data | 78.1% |
An update that touches the last transaction timestamp in the user table and occurs after one or more transactions are inserted for a user | 8.6% |
The update which touches the last login timestamp in the user table during login | 8.1% |
Interestingly, the first and second most impactful queries occur within a single transaction. When the webhook is
called, the transaction data content is bulk-inserted, and the last-transaction timestamp in the user table is updated.
This transaction takes a long time to complete and holds the row in the user table hostage until it completes.
If the webhook is called several times for a single user, we may experience a deadlock. This explains our login delays and failures: the user's row is tied up!
But why are these inserts spiking between 3 and 4 pm on weekdays? It's likely that one of our partner banks is simply calling our webhook via a cronjob that runs at 3 pm on weekdays.
Handling Bursty Workloads
In this case, the spikes in database load originate outside our system. We could try asking the partner nicely to spread out their webhook invocations (check your contract, it might be in there!). But if you're a small startup, asking a bank to change its systems and help spread its load is not likely to bear fruit.
Instead, we can use a queue to smooth out spikes and control throughput. When properly resourced, message queues like Amazon SQS, ZeroMQ, RabbitMQ, and others can hold millions of messages in flight. The message queues will let your database work at a more reasonable pace by delaying or spacing out messages. Here's a tutorial for one approach using SQS.
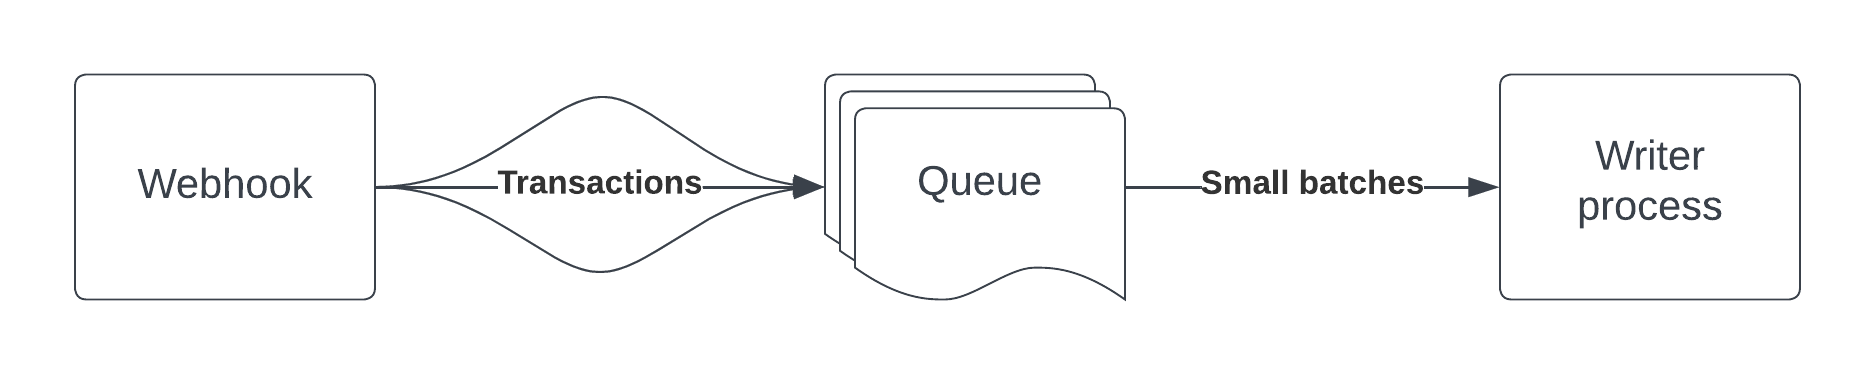
If we imagine the webhooks as a hose we cannot control and our application server as a water wheel, think of the queue as an extremely large bucket with an adjustable spout. Rather than aiming the hose directly at the wheel and overloading it, we aim the hose into the bucket and control the rate at which data reaches our application. This way, we can control the size of batches we bulk insert and the number of those batches we insert in a given time.
Here's an example architecture:
Lessons Learned
- Observability tools like database monitoring and APM can often help us spot production issues faster than simply reading logs, but good logging habits are key to tying patterns in APM to code points.
- Not everything has to be synchronous (some might argue most things shouldn't be!). Using highly available tools like queues and streams can help smooth out load over time and prevent unpredictable bouts of unavailability.
Challenge 2: Missing Transactions in Our Node.js App
Scenario: As a user, when I log into the app, I expect to see all of my transactions from more than 24 hours ago, but some of my recent (and older) transactions are missing.
Missing data is a significant problem for our app. If we fail to report spending, users may incorrectly believe they are within their budget and spend more than they should.
Let's say a user reports a specific transaction at 3:15 on 2023-01-12 for -€12.00 that appears on their statement, and we can confirm by querying our database that we have no record of it. Because all of our transaction data comes through our bank partners, those partners are the source of truth. If it turns out the partner missed this transaction, it's a bit of a mixed bag — there isn't necessarily any work for us to do to fix the issue, but we also don't have a solution to offer the customer.
This particular customer's bank has a synchronous HTTP API we can call to fetch the user's transactions on demand. Calling the API reveals that the bank does, in fact, know about the transaction. We should confirm they sent us a webhook by looking at our request logs.
The example below uses AWS CloudWatch syntax to query logs generated by logging middleware in our application code:
fields @timestamp, @message
| filter path = "/hook/transaction"
| filter method = "POST"
| filter account.number = 1940117
| filter amount = -12.00
| filter @timestamp > "2023-01-12 03:00:00" AND @timestamp < "2023-01-13 04:00:00"
| sort @timestamp desc
| limit 20
This query yields zero results. We have a 30-minute message delivery SLA with this partner, so we might conclude they just didn't send the message at all.
But before we cast any blame and make an incident out of this, we should take a step back and see what our system was doing at this time. If we remove the request-specific query filters and just look at all the logs, we may notice trends like an upstream error, dropped database connection, or other internal errors.
Using this broader query, we find quite a few messages to sift through:
fields @timestamp, @message
| filter @timestamp > "2023-01-12 03:00:00" AND @timestamp < "2023-01-13 04:00:00"
| sort @timestamp desc
| limit 20
But two stand out in particular. The first is a stack trace indicating the server crashed due to an unhandled exception at 3:17, after which there are no logs for 20 seconds while the server restarts, then the server's startup message log. This means the webhook messages were dropped outright.
For more information on stack traces and how you can monitor them in AppSignal, see An Introduction to Async Stack Traces in Node.js.
Evaluating our logs further, we receive dozens of webhook requests per second at certain points during this window (remember, this is when the provider sends the bulk of their webhooks). Each request contains as many as 100 transactions, meaning that a 20-second outage could have caused us to drop hundreds, even thousands, of transaction records.
Our Nginx reverse proxy is configured for basic request logging and confirms partner requests were dropped during the outage. Luckily, we're able to call the banks' APIs to recover missing data, but we need better uptime and resiliency to maintain our guarantees to our customers.
Restarting: Not Always Enough
Even once we've fixed the culprit uncaught exception that caused the app to crash (and even if we properly implement error handling middleware to prevent similar issues), we can never be 100% sure our process won't crash — we wrote the program, after all!
This is why it's important to have redundancy, as well as automatic restarts. Process managers often support running multiple instances of a program (like PM2's "cluster" mode), and in certain cases, that may be all you need. But the kind of load bursts our application undergoes merits something more sophisticated. This is a great time to evaluate containerization and clustering with a tool like Kubernetes or AWS Elastic Container Service. A container manager will manage multiple instances of our program with dedicated resources, automatic restarts, and a load balancer.
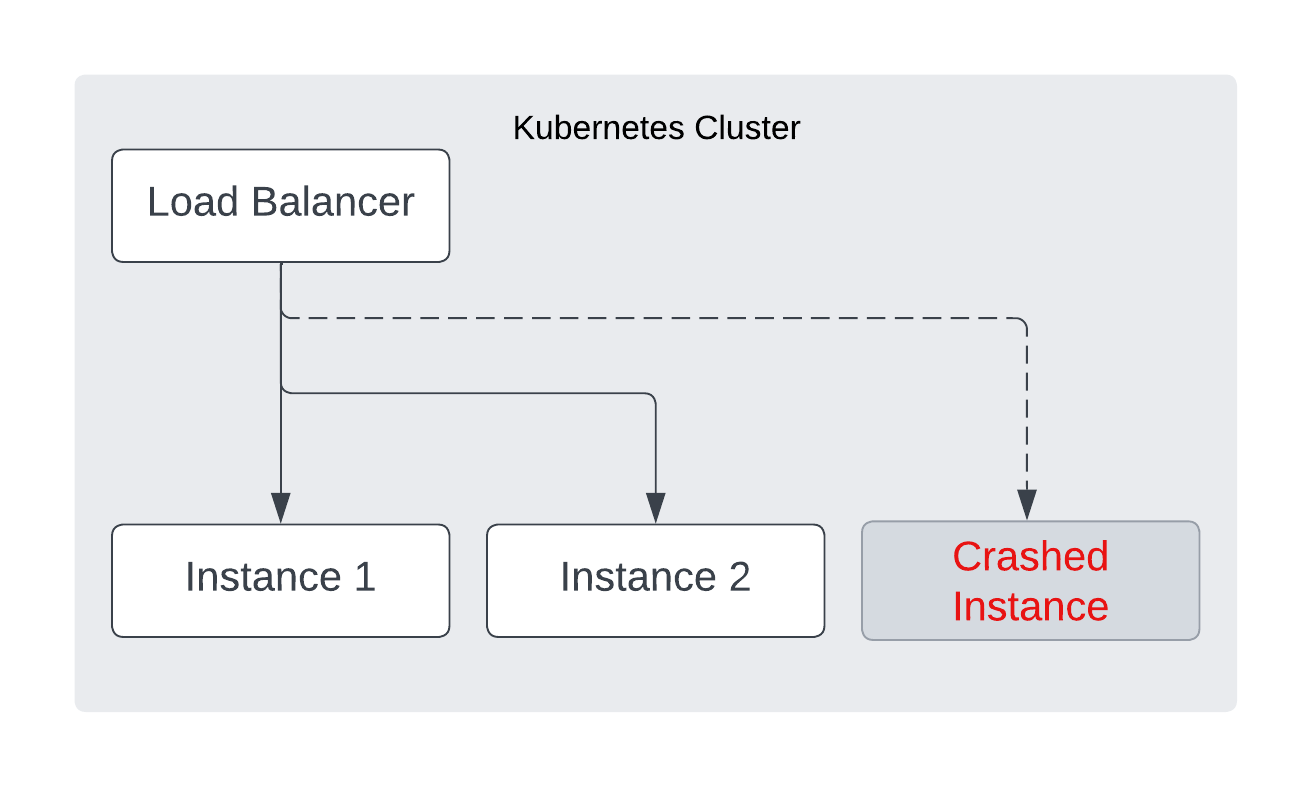
This way, even if one of our processes crashes and takes a long time to restart, the load balancer will simply direct traffic to the healthy nodes until the crashed node is replaced. Even in the unexpected event of a process exit, we will only experience true downtime if all three instances crash.
The Benefits of Queueing
This is also a great time to reiterate the benefits of queueing. Imagine if, instead of consuming data directly from webhooks, we simply read the request data and enqueue it on a highly reliable queue. It's relatively easy to make software like this very reliable; it isn't doing anything complex, is easy to write tests for and to load tests in a deployed environment, and it can use serverless technologies to scale quickly.
Once the messages are on our queue, they will stay there until "acked" (short for acknowledged). If our database writing process crashes in the middle of handling some messages, those messages aren't lost to the ether — they remain in the queue until someone tells the queue to release them with an ack. And if non-fatal errors prevent the messages from being processed, we can place them on a dead-letter queue to be replayed later (quickly remedying the data missing from our application without coding up a new solution to read from the banks' APIs). Queue replayability is a fantastic failsafe when dealing with stream-like data and is relatively simple to implement — see this example with AWS SQS.
Lessons Learned
- We shouldn't find out about downtime by noticing missing data. Configure an APM like AppSignal to monitor your application's uptime and address downtime before it becomes a bigger problem.
- Restarting after a crash often means downtime unless you have redundancy. Clustering is a great way to achieve reliable redundancy.
- Replayable queues can help you go back in time to catch streamed data your application missed the first time.
Challenge 3: Transactions Taking A Long Time to Load
Scenario: As a user, I log into the app and expect my transactions to display right away, but they take a long time to load. Basic profile information loads quickly, but transactions do not.
This one isn't surprising, right? The scale of transaction data in our system makes it a prime candidate for bottlenecking requests — look at the size of our tables:
| Table | Rows | Size on Disk |
|---|---|---|
user | 129K | 258MB |
session | 241K | 120MB |
transaction | 39M | 46.8GB |
Transactions are both the largest and most plentiful records in our relational database — averaging 302 transactions per user at 1200 bytes per transaction, we end up with a pretty sizeable table.
Naturally, the first thing we should do when a query runs slowly is to ensure we take proper advantage of indexing. It is likely that multiple queries on this table can be optimized, but let's just look at the one that runs when a user initially views their transactions in the mobile app (again, our APM can help us identify this by monitoring for slow RDBMS queries).
This query loads up to 50 settled transactions selected in the last 30 days for the logged-in user. It might look something like this:
SELECT
    user_id,
    card_id,
    transaction_id,
    amount,
    merchant_name
FROM transaction
WHERE
    user_id = 155
    AND card_id IN (210, 340)
    AND settled_ts > (NOW() - INTERVAL '30 day')
LIMIT 50;
This query runs a lot, so we should have an index on the table covering the clauses in the filter expression — user_id
and settled_ts. This is easy enough to verify:
| Index Name | Index Type | Columns |
|---|---|---|
transaction_pkey | BTREE | transaction_id |
user_card_ts_idx | BTREE | user_id, card_id, settled_ts |
fraud_alert_idx | BTREE | merchant_name, amount |
We can use an EXPLAIN or EXPLAIN ANALYZE query
to confirm that the index is being used. With PostgreSQL, we would look for a line similar to Index Scan using user_ts_idx on transaction. Index Only Scan and Bitmap Index Scan are also good news in this output.
When a query that uses indices correctly continues to be slow, it can be for several reasons:
- The index columns may have insufficient cardinality relative to the table size.
- The query may result in a lot of inefficient table access.
- Your index could be too large to fit into memory.
For the first two scenarios, you can try a handful of diagnoses and solutions.
But in our case, the third issue is the most likely. Our table is rather large, our index is composite, and our
database server is not particularly beefy. With only 1GB of memory and lots of concurrent usage, the
database server likely can't keep the entire user_card_ts_idx in memory at all times and must page the disk to traverse the
index.
Disclaimer: I am not an expert in relational database indexing and query optimizations, so I will avoid going into too much detail on ways to internally reduce the cost of your queries. I can say that BTREE indices are great when used appropriately, but large tables often demand more than just a new or modified index when queries start to slow down. When indices do meet their match, you still have options to restore performance.
Table Partitioning
When your index becomes so large that it:
- Slows down inserts
- Can't fit into memory without paging to disk
- Isn't selective enough to provide the needed performance, relative to the number of tuples in your table
Then you can partition your table (effectively, divide it into smaller tables) to gain a couple of benefits:
- Smaller tables to query. An effectively partitioned table can chop down the size of the table you are actually querying by orders of magnitude. When your access patterns are well-defined, and you partition your table along boundaries that queries are unlikely to cross, you can significantly reduce query times.
- Smaller indices speed up writes. Smaller tables mean smaller indices, and when your writes follow the same patterns as your reads, you may see similar (or even greater) performance boosts to queries that write to the table. Faster writes may also reduce your risk of deadlocks.
Upgrading your Database Server
I realize the example of an index overwhelming a database server with 1GB of memory is a bit comical. It's pretty rare, in my experience, for production systems with 6-digit user counts to rely on a database host this small for many reasons, not just index sizes. But I have seen much larger database boxes slowed down by much larger indices.
I don't recommend jumping to this solution straight away, because it's sort of a cop-out. However, if you have a large table and index that you know will grow at a rate of 10% per year, and can double the memory available to your database host, you can often buy yourself a few years of performance for a few dollars per month. However, if your table is growing rapidly and you're trying to keep costs low, it's better to save this option for last.
INCLUDE Key Columns in your Index
It may be the case that you only need one or two columns not in your index. In this case, just INCLUDE those columns in your index to prevent traversing the
potentially long linked lists of nodes in your B-Tree.
Consider A Different Data Store
Just like upgrading your database server, this can be a cop-out solution — often an even more expensive one due to the required development time. However, if your slow query is on a table that will continue to grow rapidly and your access pattern demands a fat index, you might consider a NoSQL database. Horizontal scaling offers a more linear cost schedule, and the high levels of abstraction and consistency offered by relational databases often come at the cost of performance. If we are willing to move the abstraction to our application code, we can reap significant benefits.
Also, if your business's needs change rapidly or often, you may find it difficult to re-index the database and adjust your queries fast enough to keep up. Consider adding a search engine like Elasticsearch as a secondary datastore to increase lookup speed, then look up the actual data in your RDBMS by primary key only for efficiency.
Wrapping Up
In this post, we explored three scaling challenges and their solutions in a Node.js application.
Every business scales differently, and every codebase demands its own responses to that change in scale. If there were a one-size-fits-all approach to building scalable backends, we might all be out of a job.
It's important to remember that scaling is a challenge and a blessing — too many users is a good problem to have!
The best solution to your problem depends on your specific circumstances. Hopefully this post has helped you to consider and identify the best solutions to different scaling problems.
Happy coding!
P.S. If you liked this post, subscribe to our JavaScript Sorcery list for a monthly deep dive into more magical JavaScript tips and tricks.
P.P.S. If you need an APM for your Node.js app, go and check out the AppSignal APM for Node.js.