
Node.js 12.x onwards introduced async stack traces. Async stack traces allow developers to view the call stack of asynchronous code, making it easier to trace and debug code issues.
In this post, we’ll see how async stack traces work, how you can use them to debug code, and how to track them using AppSignal. Ready?
Let's get going!
How Async Stack Traces Work in Node.js
In JavaScript, asynchronous code is executed through callbacks, promises, and async/await. When an error occurs in asynchronous code, it can be difficult to trace its origin because the call stack is not captured at the point of the error. Async stack traces capture the call stack when the asynchronous code is scheduled rather than when it is executed, allowing developers to see an error's full context.
Node.js uses an event-driven, non-blocking I/O model for handling asynchronous code execution. An event loop constantly checks for new tasks, executes them one by one, and registers callback functions for tasks that do not block the execution. This allows Node.js to handle multiple tasks simultaneously, improving performance and scalability.
Async stack traces capture the call stack when an async operation begins using "long stack traces". When an async operation starts, Node.js creates a new execution context that includes information about the current call stack and the location where the async operation was initiated. This execution context is then passed along with the async operation as it is scheduled and executed.
When an error occurs, Node.js can reference the execution context to determine the entire call stack at the point where the async operation began. It enriches the stack property of Error instances with async stack frames, i.e., await locations in the code. These async frames are marked with async in the stack string. You can see the full context of an error, including the function calls and variables that led to the error.
Node.js Async Stack Traces: A Code Example
Consider the following code. An async function init() calls funcOne(), which then calls funcTwo(), which then calls and throws funcThree(). Async stack traces will print a stack trace with init(), funcOne(), funcTwo(), and funcThree().
const funcThree = async () => {
  await Promise.resolve();
  throw new Error("Oops");
};

const funcTwo = async () => {
  await Promise.resolve();
  await funcThree();
};

const funcOne = async () => {
  await new Promise((resolve) => setTimeout(resolve, 10));
  await funcTwo();
};

const init = async () => {
  await new Promise((resolve) => setTimeout(resolve, 10));
  await funcOne();
};

init().then(
  () => console.log("success"),
  (error) => console.error(error.stack)
);
This results in an output like so:
node ./asyncStackTraces.js

Error: Oops
    at funcThree (/Users/kennethjimmy/Desktop/asyncStackTraces.js:3:9)
    at async funcTwo (/Users/kennethjimmy/Desktop/asyncStackTraces.js:8:3)
    at async funcOne (/Users/kennethjimmy/Desktop/asyncStackTraces.js:13:3)
    at async init (/Users/kennethjimmy/Desktop/asyncStackTraces.js:18:3)
If we run the same code on a version of Node.js older than 12, the output looks like this:
node ./asyncStackTraces.js

Error: Oops
    at funcThree (/Users/kennethjimmy/Desktop/asyncStackTraces.js:3:9)
    at <anonymous>
In this case, at <anonymous> isn’t very helpful in revealing the full context of the error.
However, this works differently with async stack traces. When an error occurs in a callback function, the call stack is captured at the point when a callback is scheduled (the init() function in this case), rather than when it is executed.
Set Up AppSignal for Your Express.js App
AppSignal can assist you in identifying and troubleshooting problems with your app, including issues related to slow performance, errors, crashes, and downtime. You can resolve these issues quickly before they negatively impact your users.
In this tutorial, we will walk you through how to integrate AppSignal into your Express.js app.
Note: You can follow along with the source code for the following tutorial here.
Firstly, sign up for an account on appsignal.com and create a new app by following these guides.
Then start a new Node.js project:
npm init -y
Install AppSignal for Node.js:
npm install --save @appsignal/nodejs
In your repo’s root directory, create an appsignal.cjs file and paste the following code to require and configure AppSignal:
require("dotenv").config();
const { Appsignal } = require("@appsignal/nodejs");

new Appsignal({
  active: true,
  name: process.env.APPSIGNAL_APP_NAME,
  pushApiKey: process.env.APPSIGNAL_PUSH_API_KEY, // Note: renamed from `apiKey` in version 2.2.5
});
Note: An application's Push API key is given during setup and can be found in the App settings > Push & deploy tab.
In your package.json file, edit the start script to load AppSignal's configuration before any other library using the --require flag, like so:
{
  "scripts": {
    "start": "node --require ‘./appsignal.cjs’ app.mjs"
  }
}
Integrating AppSignal into your Express app is very easy. You just need to require the expressErrorHandler module and then use it in your app with app.use, as shown below:
import { expressErrorHandler } from "@appsignal/nodejs";

const app = express();

// add this after all routes, but before any other error handlers
app.use(expressErrorHandler());
The expressErrorHandler module consists of middleware designed to forward any errors in your Express application to AppSignal.
Tracking Async Callback Errors with AppSignal
Let's create an error inside an asynchronous callback to see how AppSignal handles it:
const funcThree = async () => {
  await Promise.resolve();
  throw new Error("Oops");
};

const funcTwo = async () => {
  await Promise.resolve();
  await funcThree();
};

const funcOne = async () => {
  await new Promise((resolve) => setTimeout(resolve, 10));
  await funcTwo();
};

app.get(
  "/trigger_error",
  catchAsync(async (req, res) => {
    await new Promise((resolve) => setTimeout(resolve, 10));
    await funcOne();

    res.status(200).json({
      statusbar: "success",
      data: {
        mentors,
      },
    });
  })
);
When accessing GET /trigger_error, an error is triggered. The server will return the error along with an asynchronous stack trace, as shown below:
{
  "status": "error",
  "error": {
      "statusCode": 500,
      "status": "error"
  },
  "message": "Oops",
  "stack": "Error: Oops\n    at funcThree (file:///Users/kennethjimmy/Desktop/app.mjs:29:9)\n    at async funcTwo (file:///Users/kennethjimmy/Desktop/app.mjs:34:3)\n    at async funcOne (file:///Users/kennethjimmy/Desktop/app.mjs:39:3)\n    at async file:///Users/kennethjimmy/Desktop/app.mjs:55:5"
}
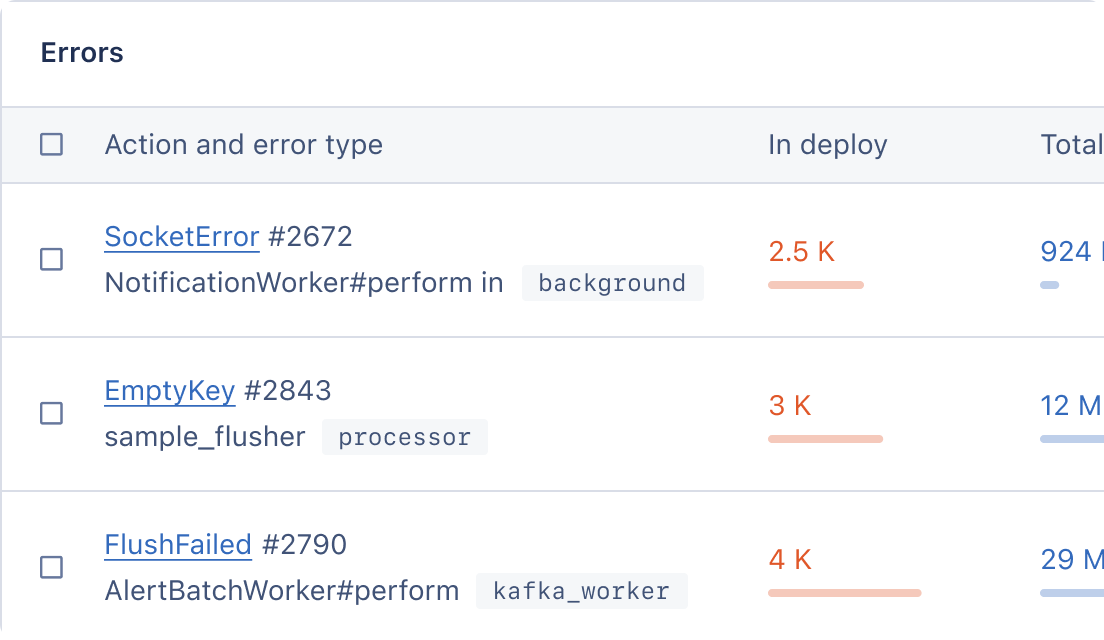
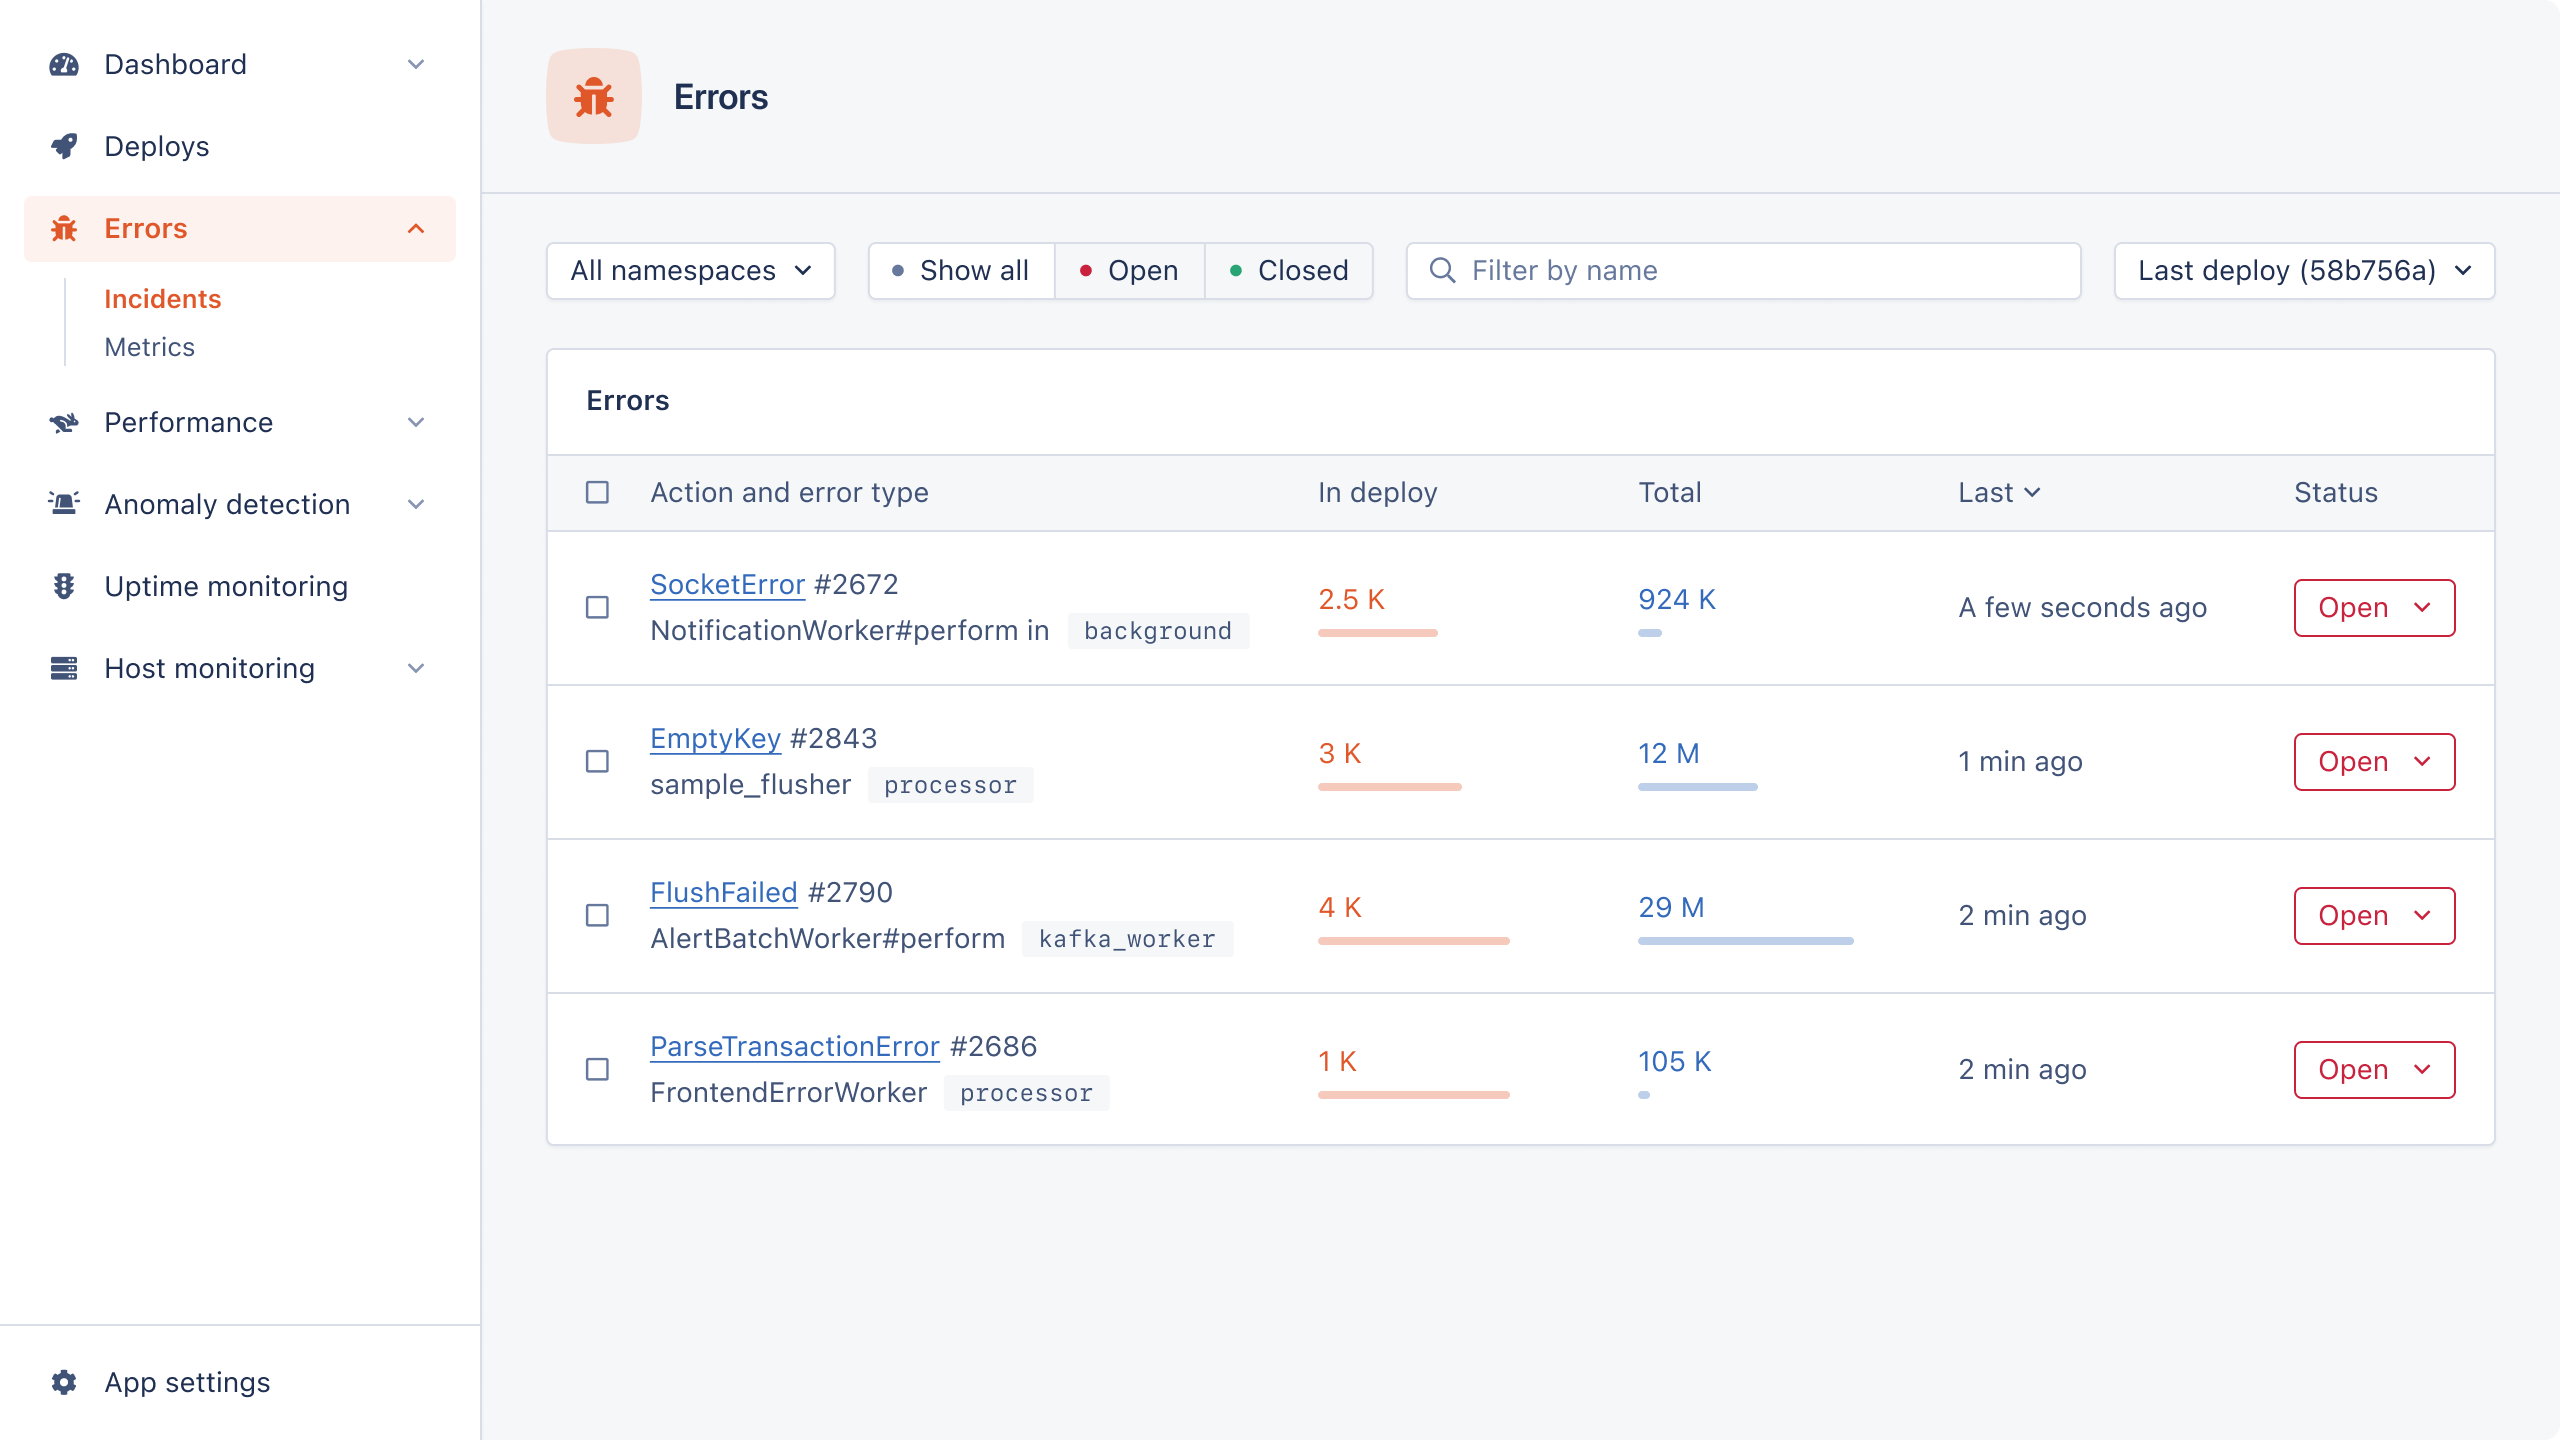
After the error is thrown, AppSignal captures and reports the exception. To view your application's errors and stack traces, navigate to the AppSignal Dashboard, select "Errors", and click on "Issue list."
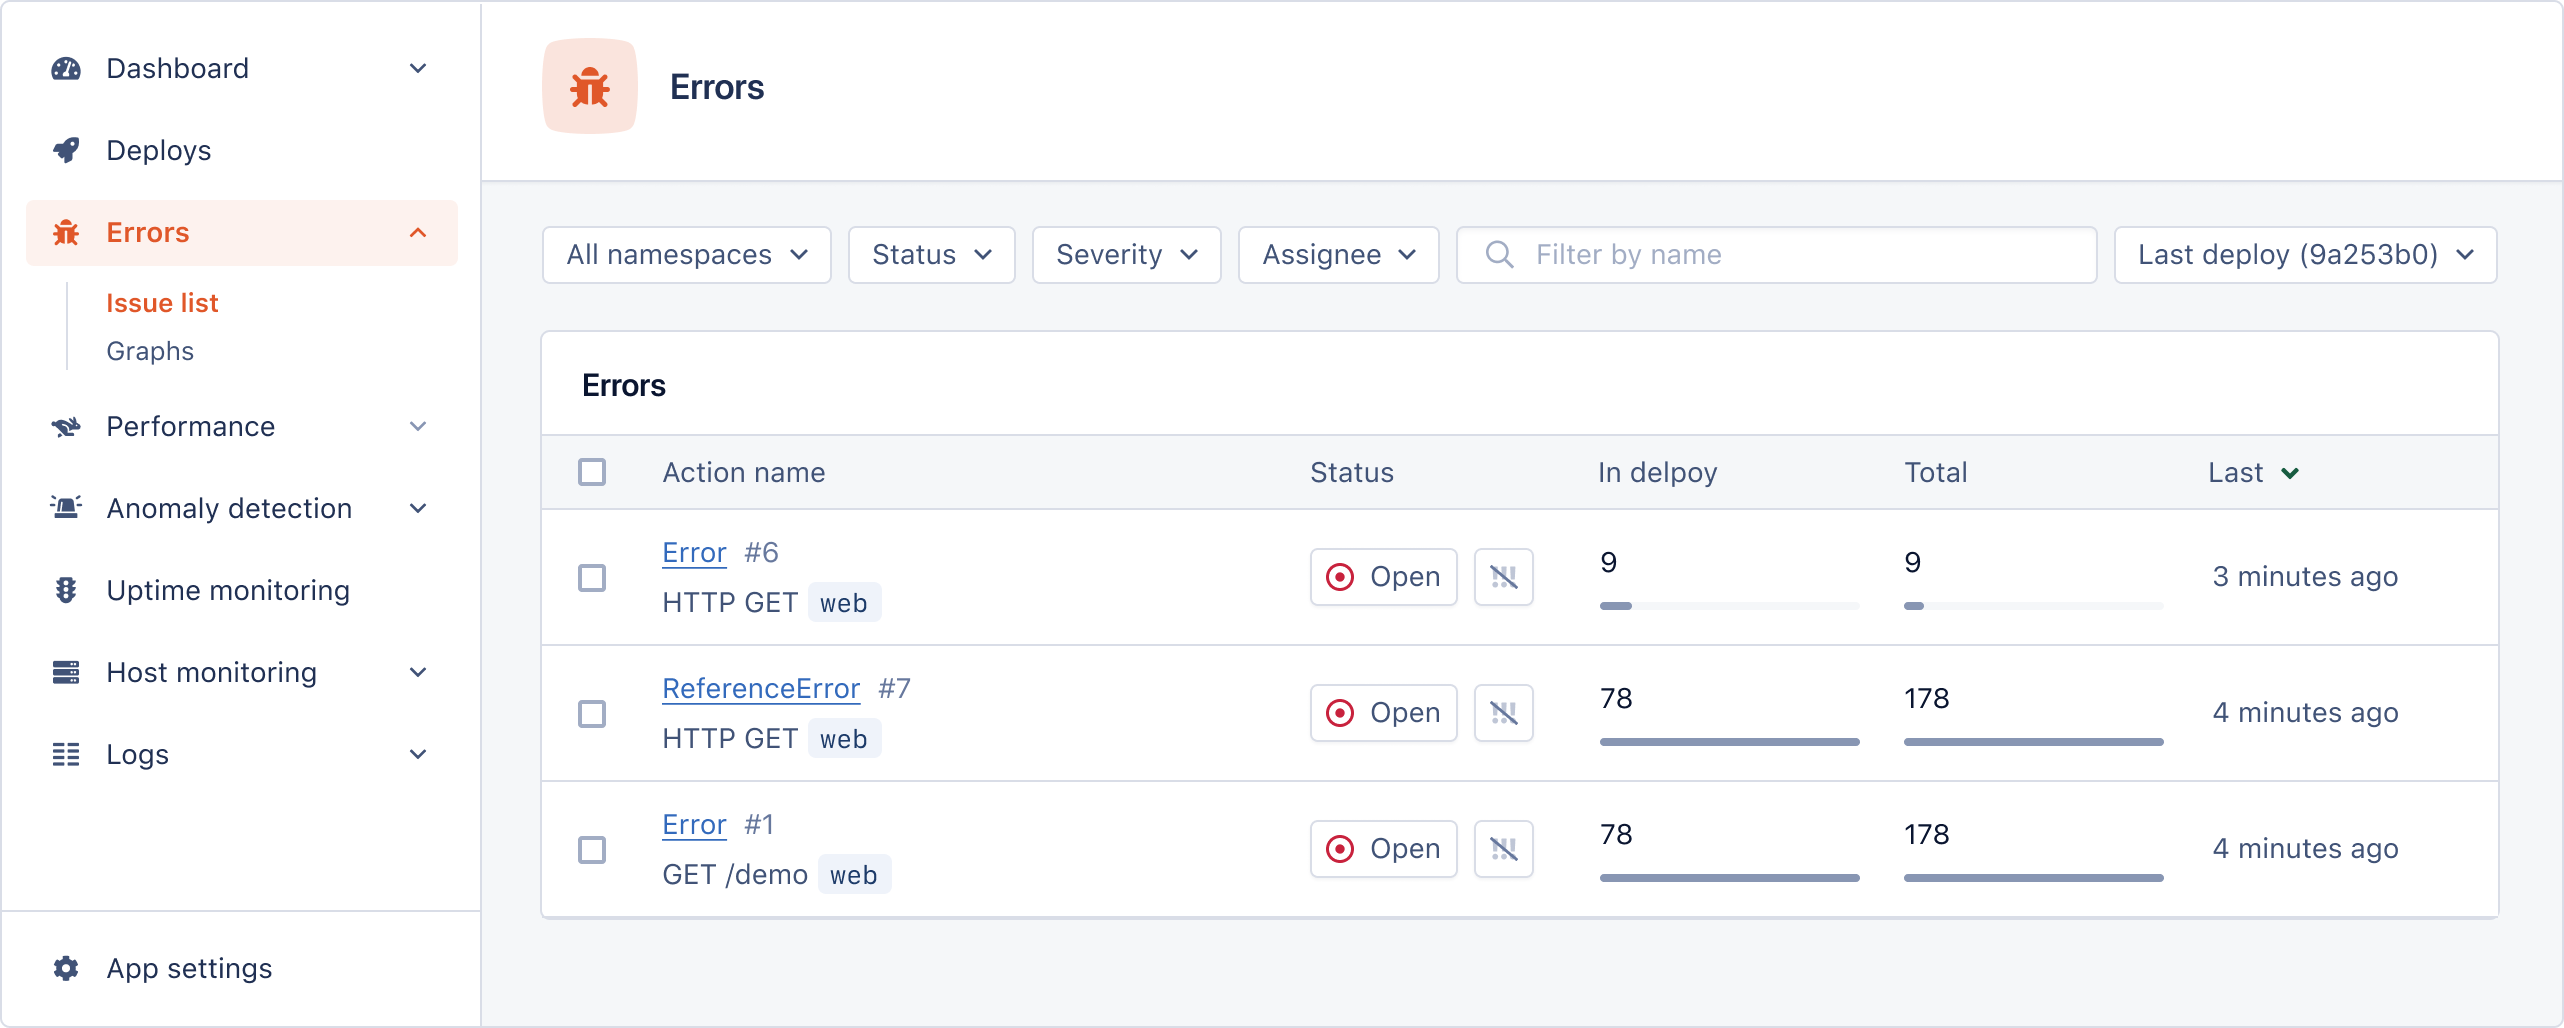
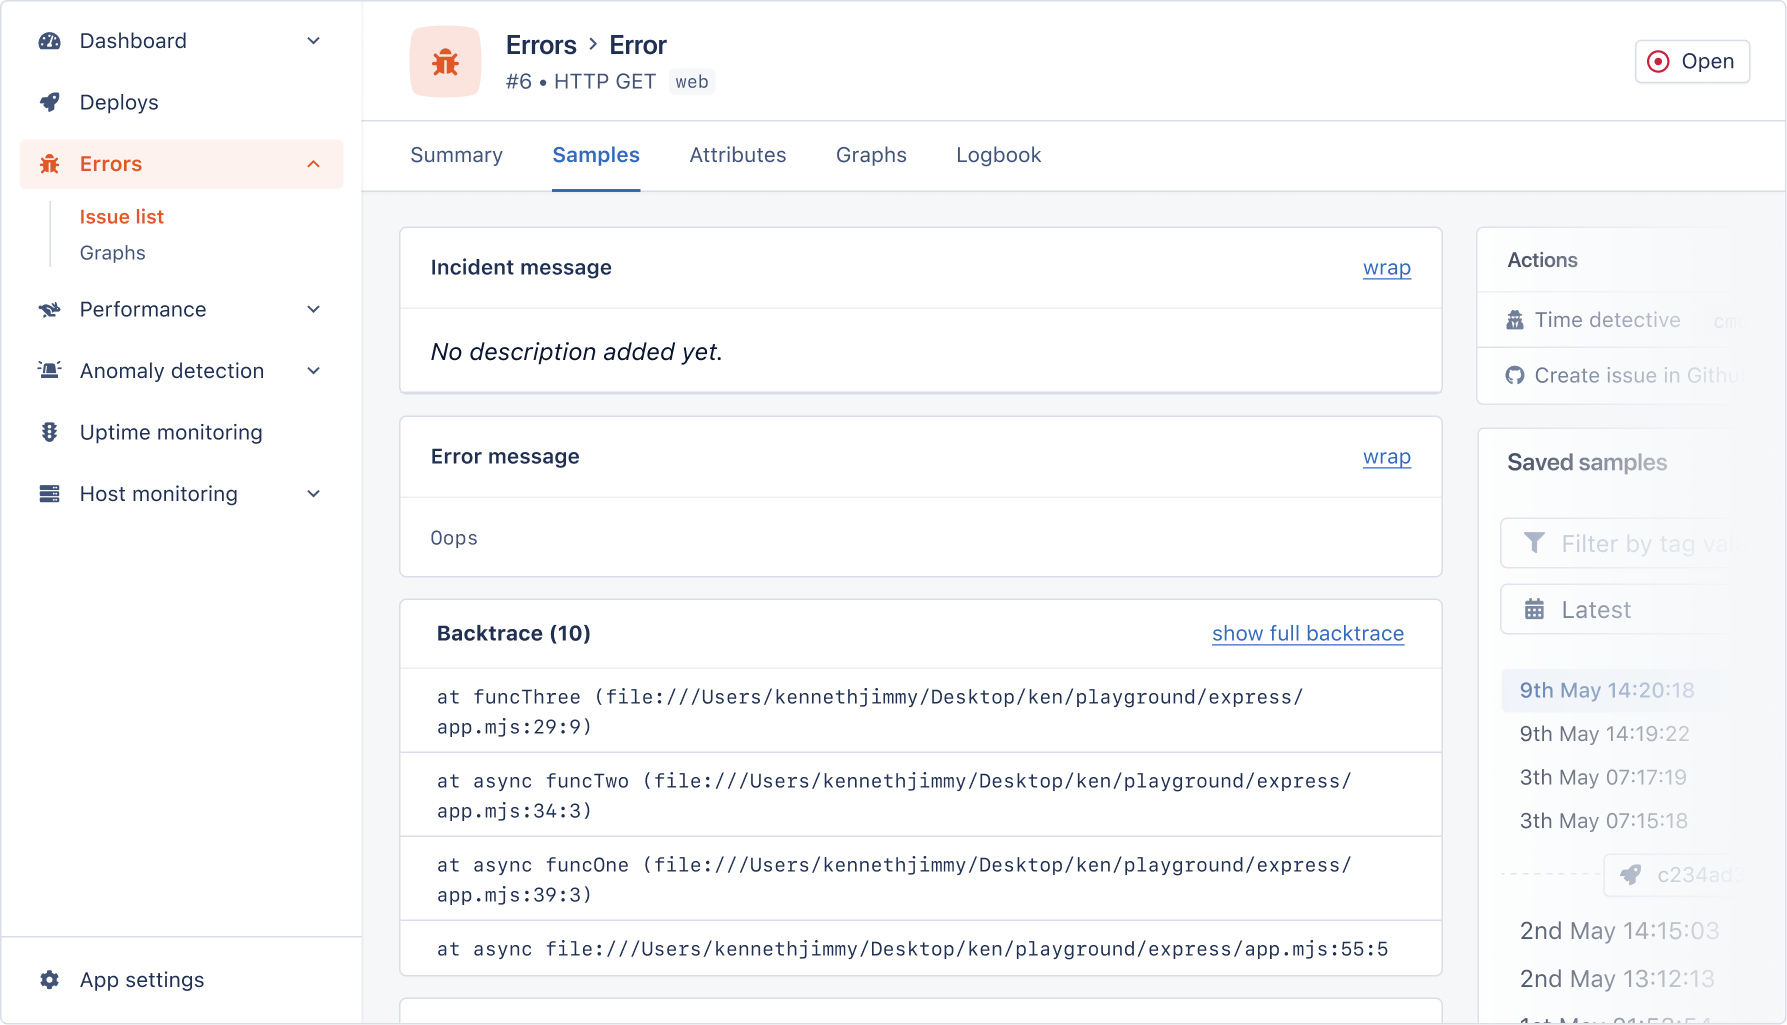
Click on a particular error to see its details, including the error message and stack trace.
Increasing Stack Trace Size in Node.js
By default, stack trace size is limited, making it difficult to pinpoint the exact source of an error. In development, we want as much context as we can get. Fortunately, it's possible to increase stack trace size in Node.js.
To do so, you can use the stackTraceLimit property of the Error object/class. By default, this property is set to 10, so only the last 10 calls will be included in the stack trace. If the value is set to 0, this stops the collection of stack traces. However, any positive integer can be assigned as the maximum limit for collecting frames. Alternatively, setting the property to Infinity will collect all the frames.
For example, to set the stack trace limit to Infinity in an Express.js application in development mode, you can use the following code:
// Set the stack trace limit to Infinity in development mode
if (process.env.NODE_ENV !== 'production') {
  Error.stackTraceLimit = Infinity
}

// Initialize Express.js app
const express = require('express');
const app = express();

// Define routes
// ...

// Start the server
const port = process.env.PORT || 3000;
app.listen(port, () => {
  console.log(`Server started on port ${port}`);
});
By increasing stack trace size, you can get more information about the execution of your code and better understand the context in which an error occurs. However, it's important to consider the following:
- Performance impact: Increasing stack trace size can negatively impact performance, particularly in cases where a large number of errors occur, or the stack trace size is set to an excessively high value.
- Memory usage: A larger stack trace size means more memory usage, which can be a concern if your application is already memory-intensive.
- Security risks: Longer stack traces can potentially expose sensitive information, such as credentials or source code, if not properly handled.
- Complexity: It can be more difficult to navigate and analyze a larger stack trace, particularly for complex applications.
With that in mind, you should use a reasonable limit that provides the necessary information without causing performance issues.
Wrapping Up
In this post, we've seen how async stack traces in Node.js can help you debug and trace errors in your asynchronous code by capturing call stacks.
We also explored how integrating AppSignal into your Node.js application makes it a lot easier to detect and resolve async callback errors in real time.
Finally, we discussed how expanding stack trace size in Node.js can offer more insights into the execution of your code and help you understand an error's context. However, it's important to use this feature judiciously, taking into account its possible impact on performance, memory usage, security, and navigability.
Happy coding!
P.S. If you liked this post, subscribe to our JavaScript Sorcery list for a monthly deep dive into more magical JavaScript tips and tricks.
P.P.S. If you need an APM for your Node.js app, go and check out the AppSignal APM for Node.js.