Node.js is a popular choice for creating a scalable and highly performant web app. Its event-driven, non-blocking I/O model makes it well-suited for building real-time, data-intensive applications.
Maintaining the health of your Node.js app includes monitoring and tracking several metrics over time to better understand how your app is performing.
Monitoring your application's health is important to ensure its smooth operation and a good user experience. By keeping track of key metrics, you can identify and address any potential issues before they become serious and costly problems.
In this post, we'll examine some key metrics to consider and see how you can use tools like AppSignal to keep track of these metrics.
Let's get going!
Your Node.js App Health: Things to Consider
It's generally a good idea to start monitoring the health of your Node.js application as early as possible, ideally before it is even deployed to production. This way, you can catch any issues that may arise during the development and testing phase, rather than waiting for them to be reported by users in production.
It's important to note that monitoring the health of your Node.js app is not a one-time task. Instead, it should be an ongoing process performed regularly to ensure your app runs smoothly. This is especially important in production environments, where users are actively interacting with your app.
Monitoring Application Health with AppSignal
Now comes the monitoring part, woo! Monitoring performance indicators in Node.js is very simple. You can opt-in to use the simple internal tools that Node provides, or you can use a fully-fledged tool like AppSignal.
To effectively monitor the uptime of your Node.js app, you should configure your uptime monitoring tool to check the availability of your app at regular intervals. This can help you identify any issues as they arise and take action to address them before they become major problems.
AppSignal is a tool for monitoring and tracking errors in your Node.js application. It provides real-time monitoring of key metrics, such as response time, error rates, and throughput, as well as detailed error tracking to help users identify and fix issues in their applications.
AppSignal also offers detailed performance insights, including transaction traces and profiling data, which can help users identify the root cause of performance issues and optimize the performance of their Node.js app.
To integrate AppSignal into your project, follow the Node installation guide.
Now let's dive into some metrics you should consider.
Key Metrics for Your Node.js App
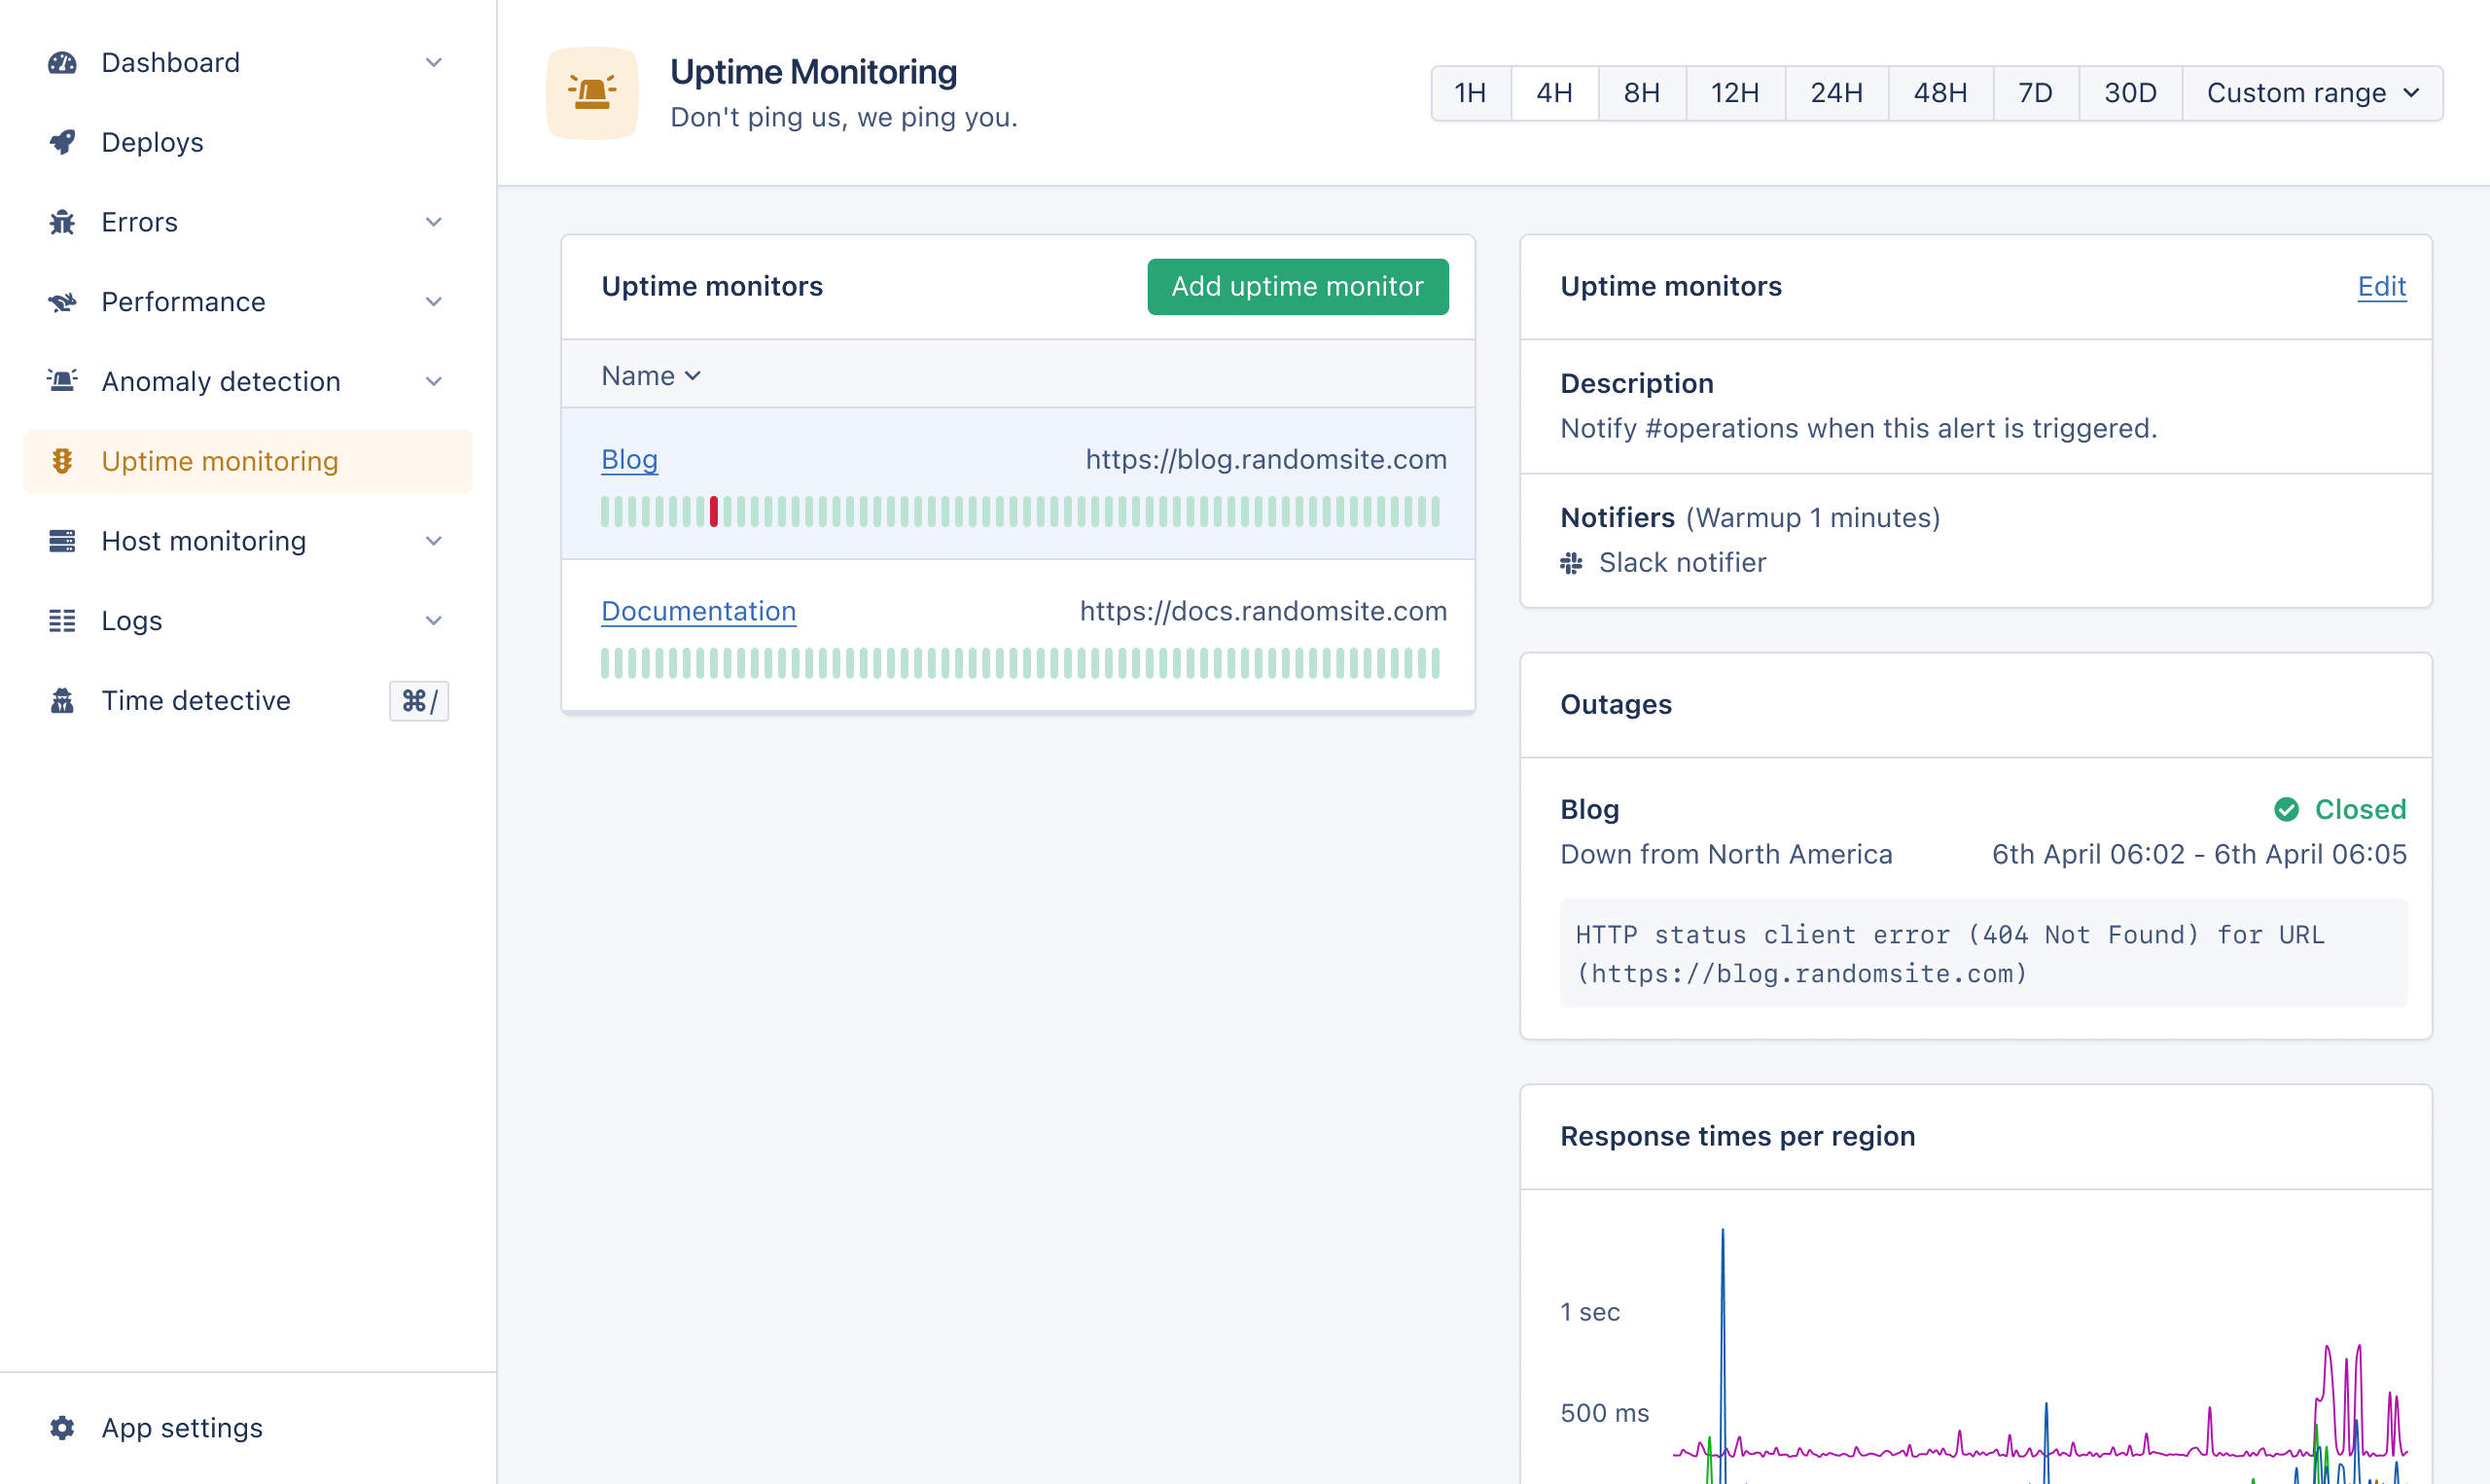
Uptime
Uptime monitoring is the process of tracking the availability of an application to ensure that your app is always available to users and minimize downtime.
Tools like AppSignal provide alerts when your app is down or experiencing performance issues, and can be configured to send alerts via email or a third-party service. It also provides detailed reporting on the performance and availability of your app. Here's how uptime monitoring looks in AppSignal:
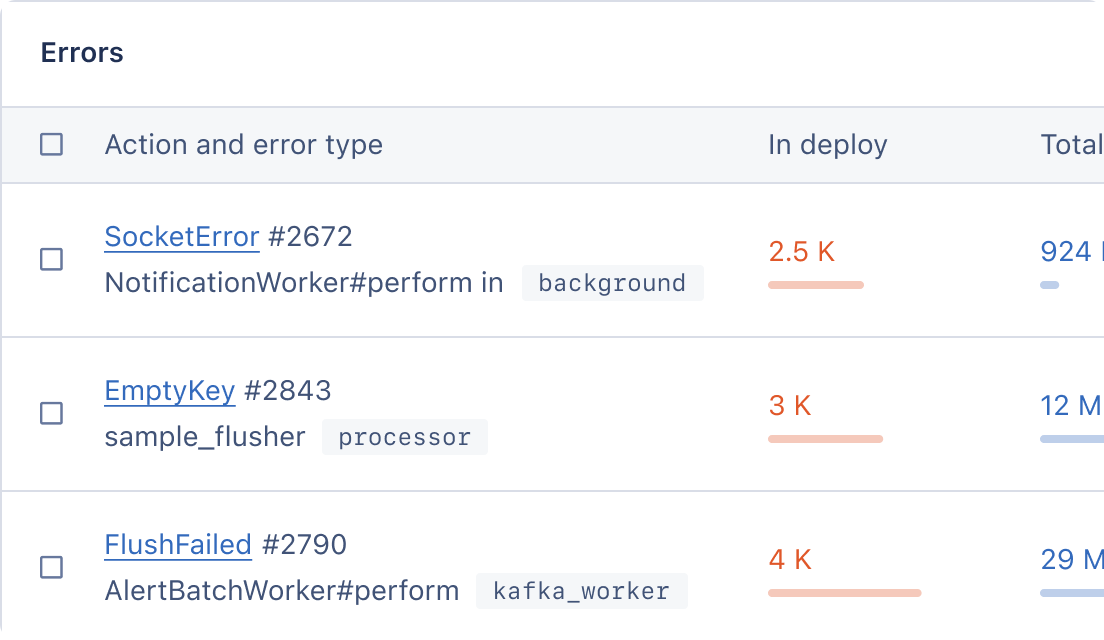
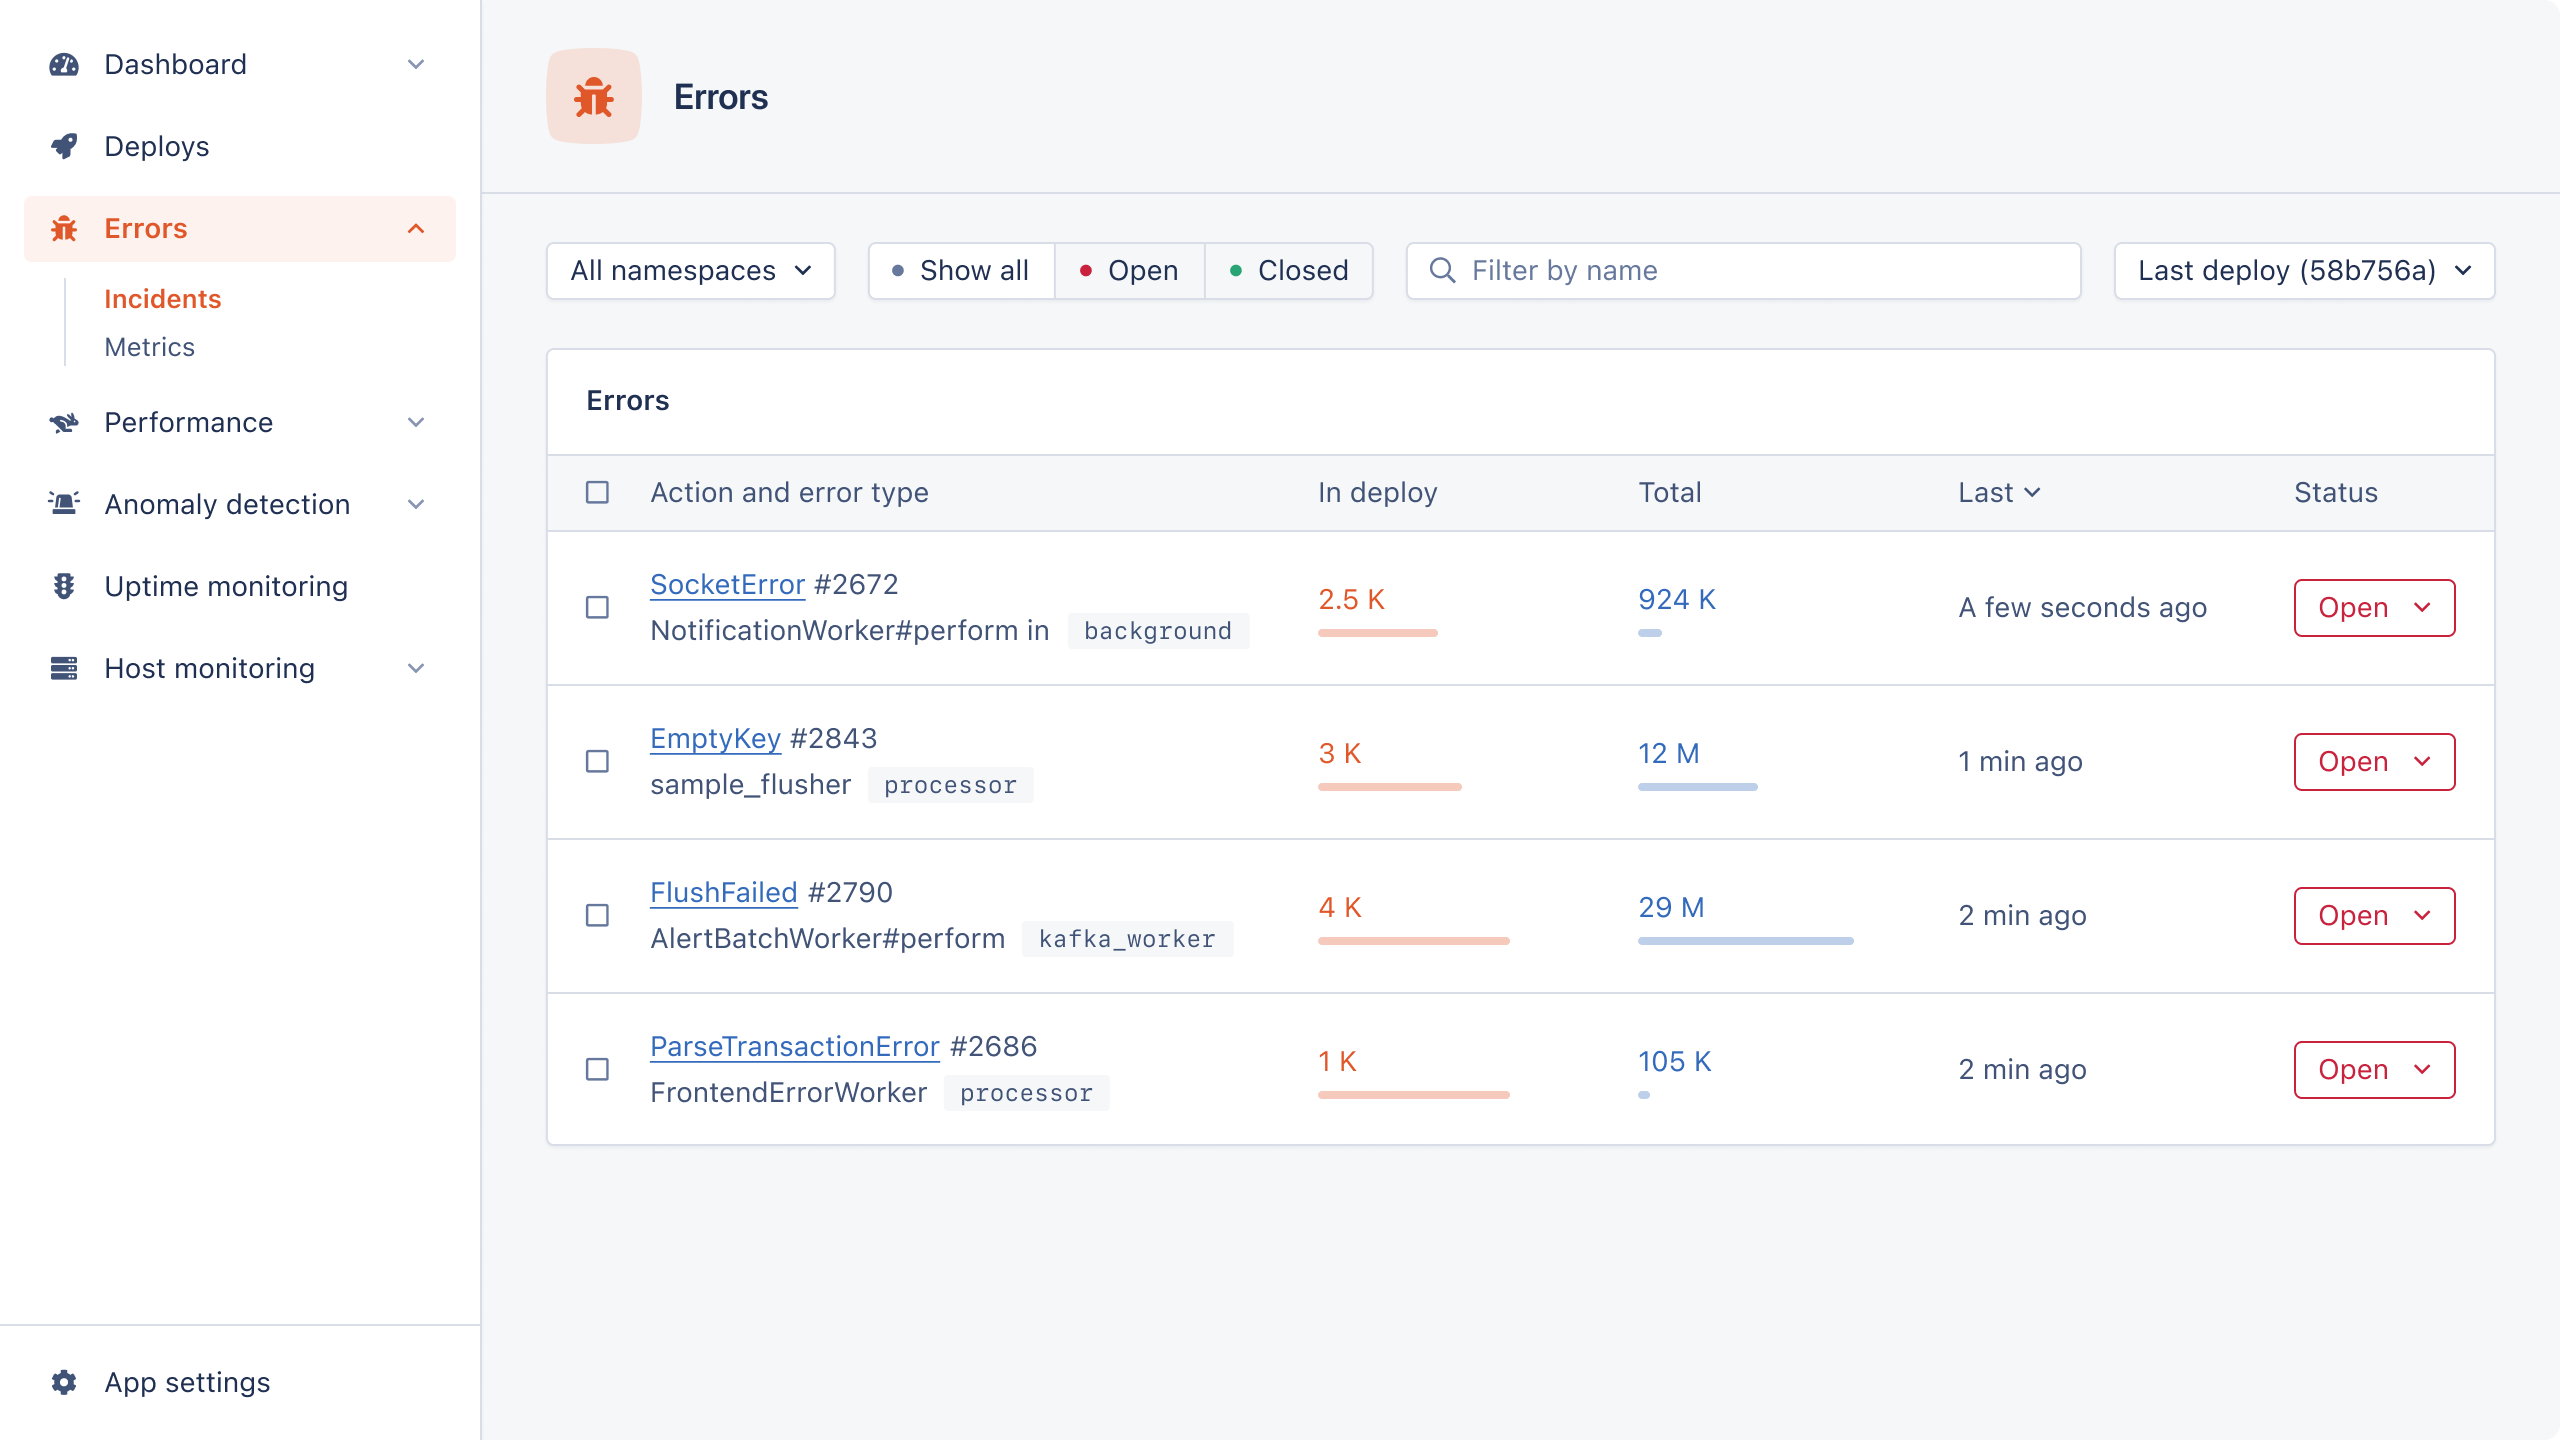
Error Tracking
Errors occur often. Catching them quickly and preventing future errors is crucial for a stable application.
AppSignal provides detailed error reports that include the stack trace, metadata, and diagnostic information, like the environment in which the error occurred and the request that caused it.
The error dashboard lets you see your issue list and has graphs that present error rate, count, and throughput.
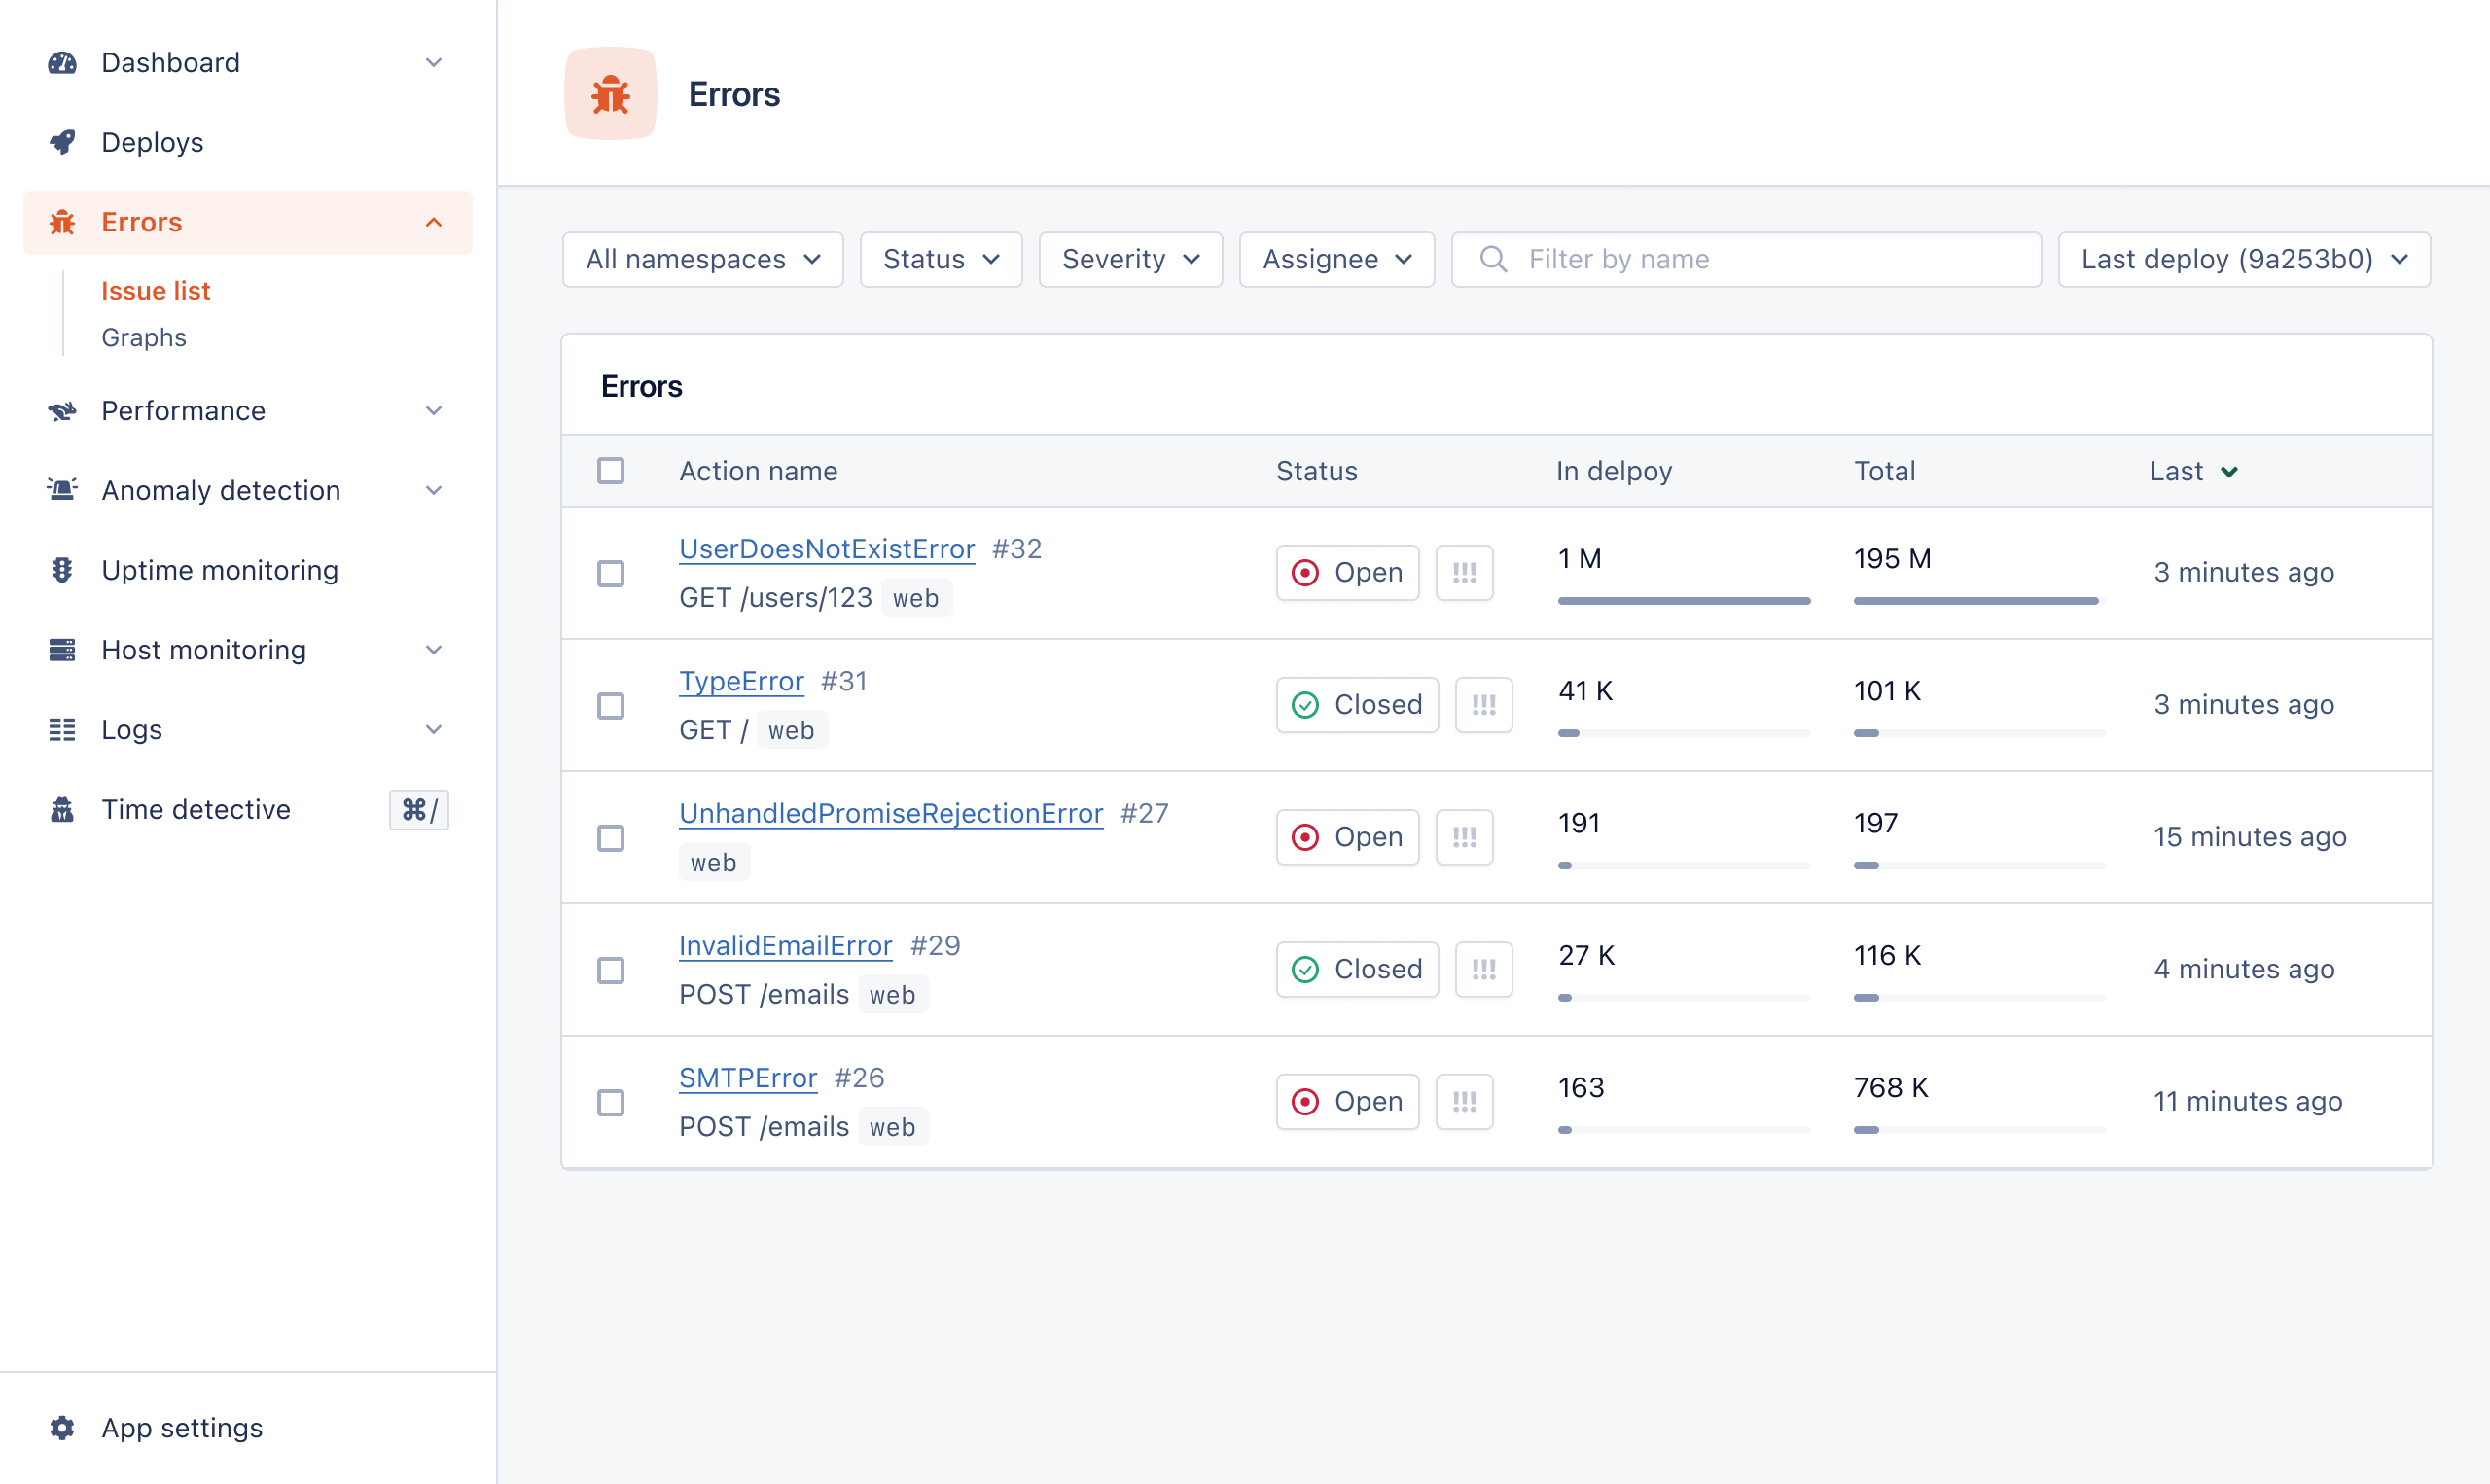
With AppSignal, you can set the severity and status for specific errors and assign errors to your teammates.
Other than tracking errors, you can also stay ahead of potential problems in your system by setting triggers that will notify you when certain conditions are met.
With AppSignal's anomaly detection, you can configure triggers that will send you a notification once a metric goes above (or below, depending on the situation) a threshold value. For example, you can set a trigger that will notify you when the free memory on your host goes below a certain value.
Performance Monitoring
Tracking performance can help you mitigate bottlenecks that slow down your application and therefore impact the user experience.
Slow requests, background jobs, and memory allocation events are just the tip of the iceberg of metrics that AppSignal can show you.
AppSignal displays a preview of performance issues, and you can drill down further to find the root cause of a specific performance issue.
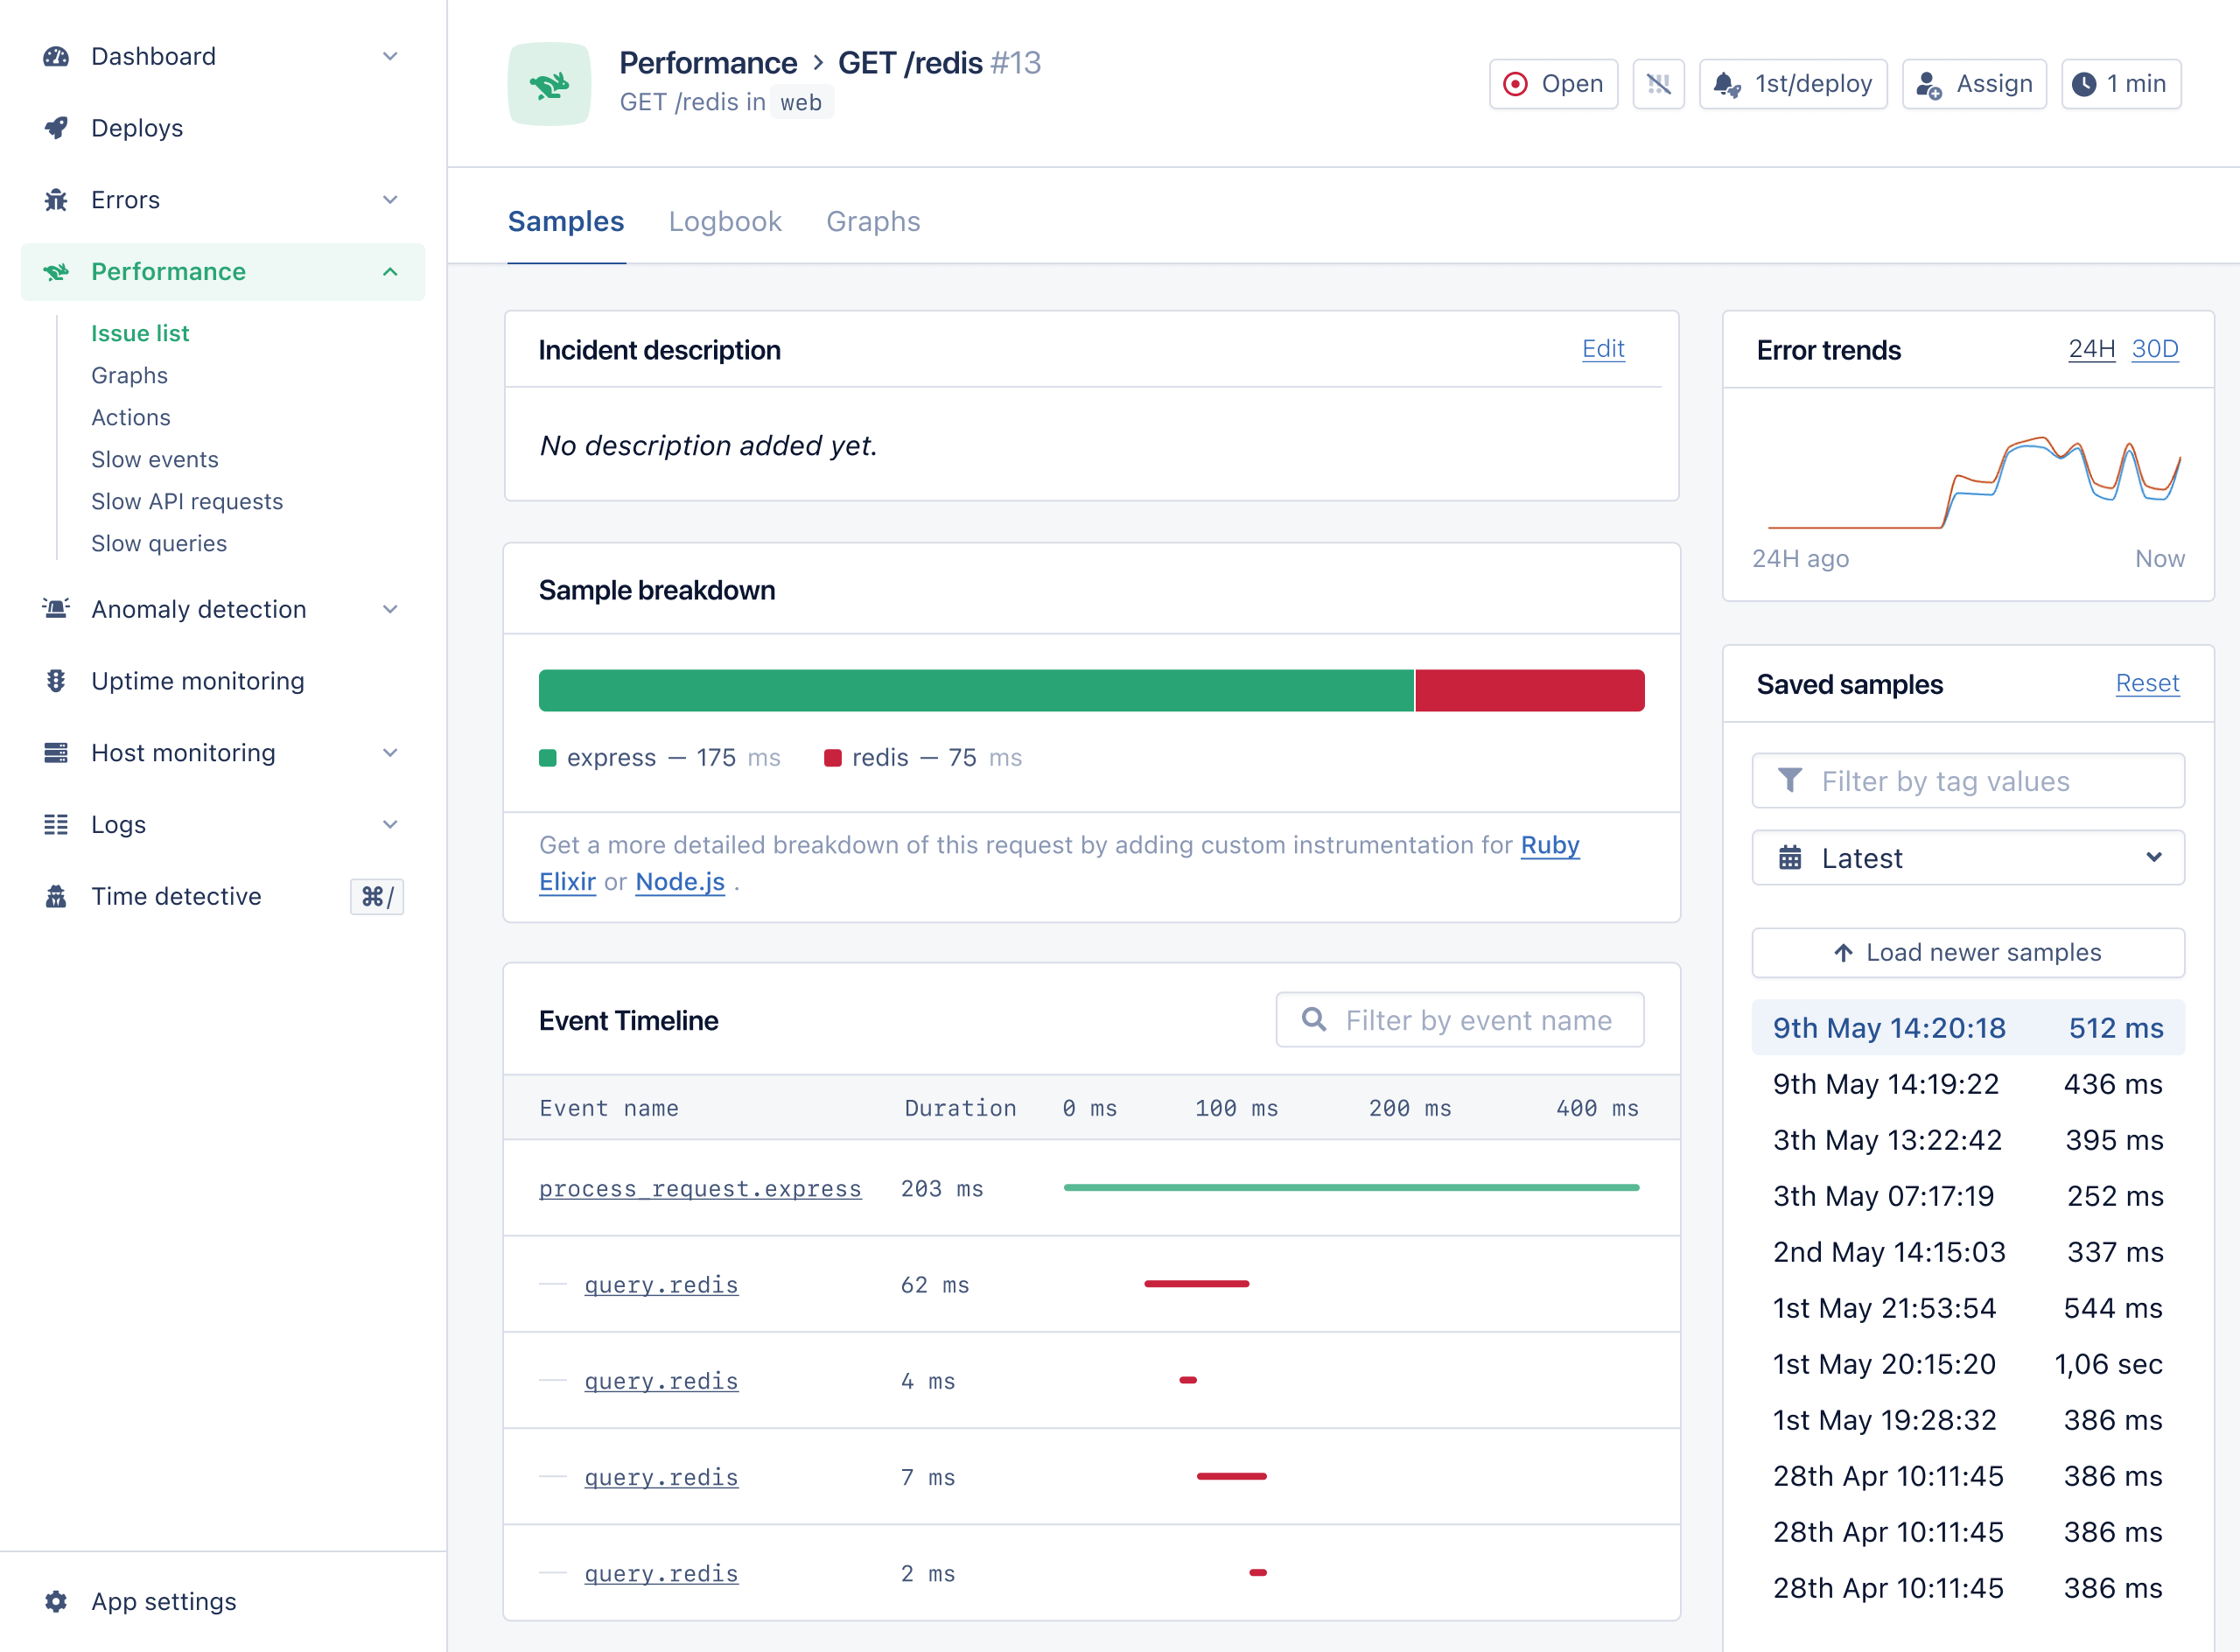
Here are some key performance monitoring metrics you can track on AppSignal:
-
Request and response time:
Response time refers to the amount of time it takes for a request to be processed and a response to be sent back to the user. A high response time can indicate some issues, such as a slow database query, a slow third-party API, or a bottleneck in your application code.
Request time, on the other hand, is the amount of time it takes for a request to be received and processed by the server. This can be affected by factors such as network latency, server performance, and the complexity of the request being made.
Both response and request time are important metrics to track, as they can impact the overall performance and user experience of your Node.js app.
-
Event timeline: See behind the scenes of an event. Review requests to see which events are executed when and where.
-
Request details: See the details of the event, like hostname, pathname, request ID, and other information that is captured.
-
Global response times: Inspect global throughput and performance graphs for your web requests and background jobs. The graphs show how your apps improve over time and give great indicators of possible app-wide issues.
Host Monitoring
CPU and Memory Usage
When a part of your application isn’t optimized correctly, it tends to draw more resources, like CPU and memory. An increase in CPU and memory usage can lead to performance issues in your application.
With AppSignal’s host metrics, you can easily keep track of your application’s CPU and memory usage, in relation to the available CPU capacity and memory in the servers that run your application.
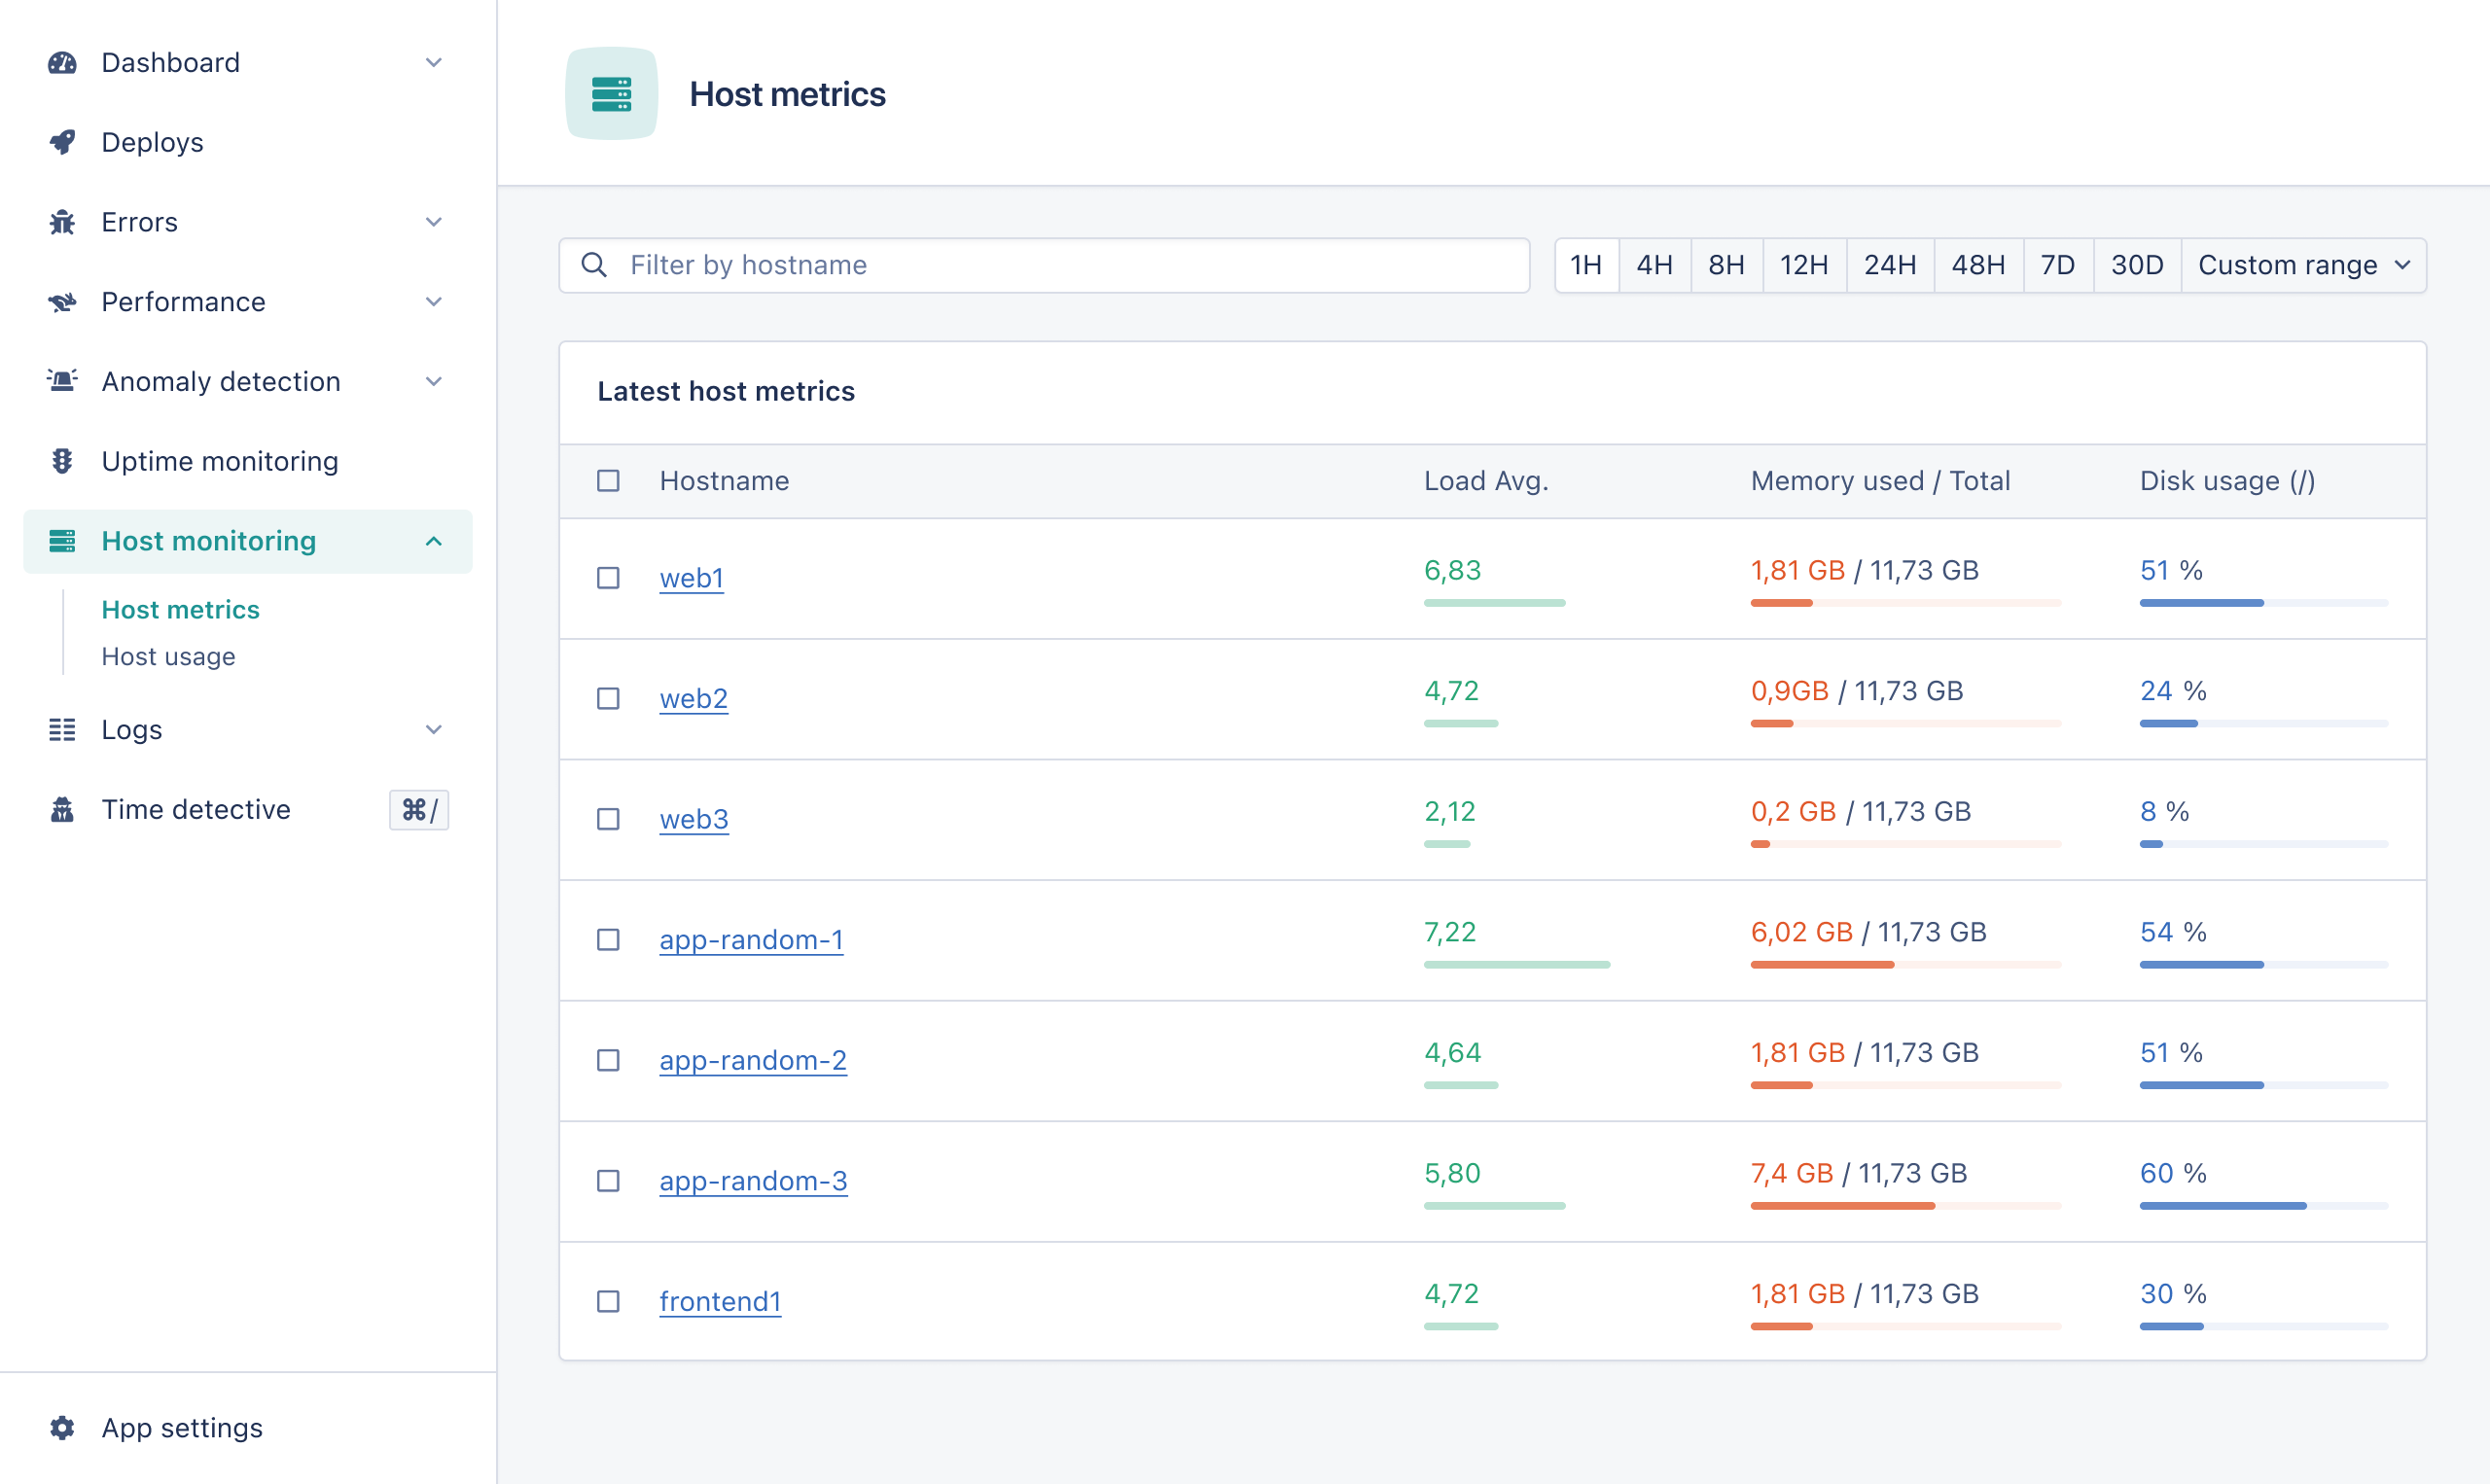
From this dashboard, you can monitor your application’s performance indicators. Spikes in CPU and memory usage can correlate to resource-intensive requests, which keep your users waiting while your application struggles to compute the required information. A continued increase in memory usage could also indicate a memory leak in your application, meaning that it does not properly release memory that's not in use.
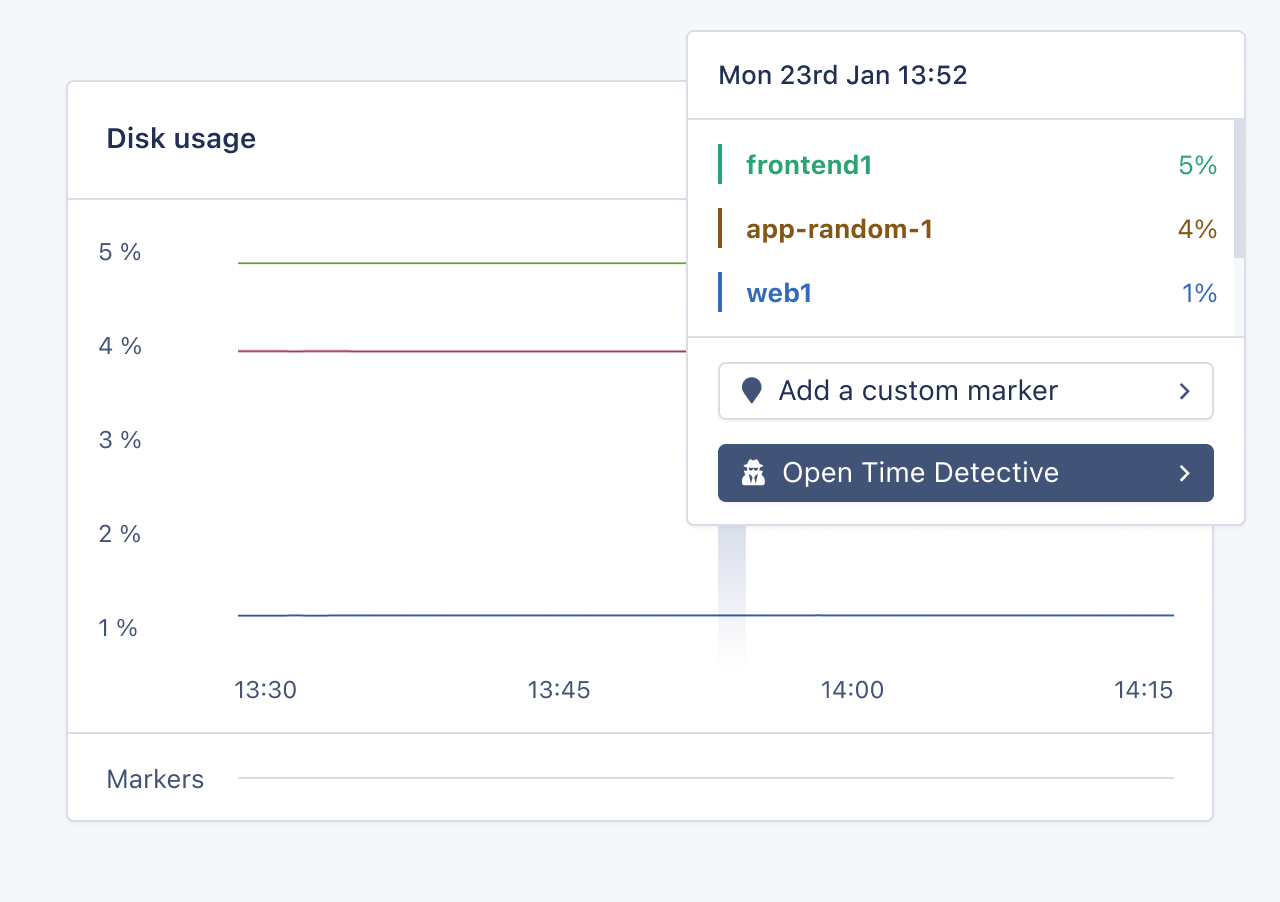
Disk Monitoring
Disk usage is an important aspect of performance monitoring, as it can significantly impact a system's overall performance. Disk usage is typically measured in terms of disk space, disk I/O, and disk latency.
It's important to monitor disk space usage to ensure your system has enough storage for your current and future needs. Running out of disk space can cause various issues, such as a system crash or data loss.
Disk latency, also known as disk response time, refers to the time it takes for the disk to respond to a read or write request. High disk latency can also indicate a performance bottleneck and slow system response.
You can view your disk usage in AppSignal:
Network Monitoring
Monitoring network bandwidth can help you determine if the network's capacity is sufficient to support your application and users' current and future needs. If the network is operating near its capacity, this can cause slow performance and other issues, such as packet loss and network congestion.
Several aspects of network bandwidth can be monitored:
- Bandwidth utilization: The amount of bandwidth currently in use on the network.
- Throughput: The amount of data transmitted over the network in a given period of time.
- Packet loss: The number of packets that are lost during transmission.
- Latency: The time it takes for a packet to travel from one point to another on the network.
- Error rate: The number of errors that occur during transmission.
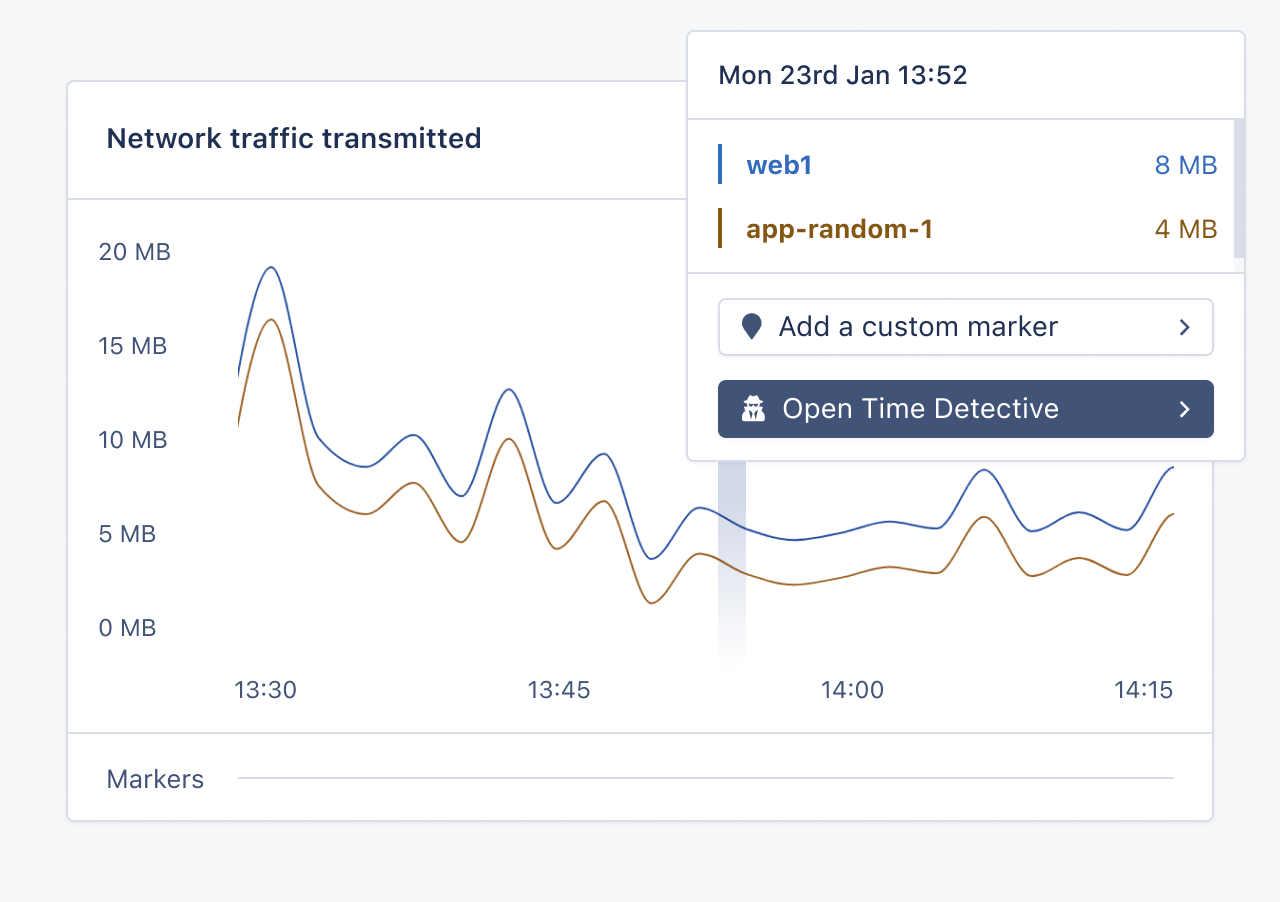
Here's how our transmitted network traffic graph looks in AppSignal:
Best Practices for Monitoring Your Node.js Application
There are a number of best practices to follow when it comes to monitoring the health of a Node.js application. Here are some key considerations:
- Early adoption: Monitoring should be integrated early into your app, so you always know how it's performing. Integrating monitoring early on can save time and resources in the long run. It's a good idea to regularly check metrics to ensure that things are running smoothly.
- Alerts: Setting up alerts is an important part of monitoring the health of your Node.js application. By setting up alerts for key metrics such as response time, error rate, and CPU and memory usage, you can be notified when any issues need to be addressed. This can help you respond quickly to problems and ensure your app runs smoothly.
- Multi-tool usage: Using multiple monitoring tools can provide a more comprehensive view of your Node.js app's health and performance. For example, you might use one tool to track key metrics, such as response time and error rates, while another tool provides detailed performance insights. By using multiple tools, you can get a clearer picture of your app's performance and identify any potential issues.
- Dependency health: It's important to monitor the health of any dependencies that your Node.js app relies on, such as third-party APIs or services. By monitoring the health of these dependencies, you can identify and address any issues that may affect the performance of your app.
- Load testing: Load testing is the process of simulating real-world traffic on your app to see how it performs under heavy load. This can help you identify any potential bottlenecks or performance issues that may arise when your app is being used by a large number of users.
- Hosting environment health: Finally, it's important to monitor the health of your hosting environment, including the server and any infrastructure.
Wrapping Up
In this post, we explored how regular application health monitoring is essential for ensuring a performant and stable application. By tracking important metrics, such as CPU and memory usage, errors, and response and request times, you can identify potential issues and address them quickly.
AppSignal is a great tool that provides real-time monitoring, detailed performance insights, and error tracking. By following best practices such as regular monitoring, setting up alerts, using multiple tools, and monitoring dependencies and the hosting environment, you can ensure your Node.js application runs at its best.
Happy monitoring!
P.S. If you liked this post, subscribe to our JavaScript Sorcery list for a monthly deep dive into more magical JavaScript tips and tricks.
P.P.S. If you need an APM for your Node.js app, go and check out the AppSignal APM for Node.js.