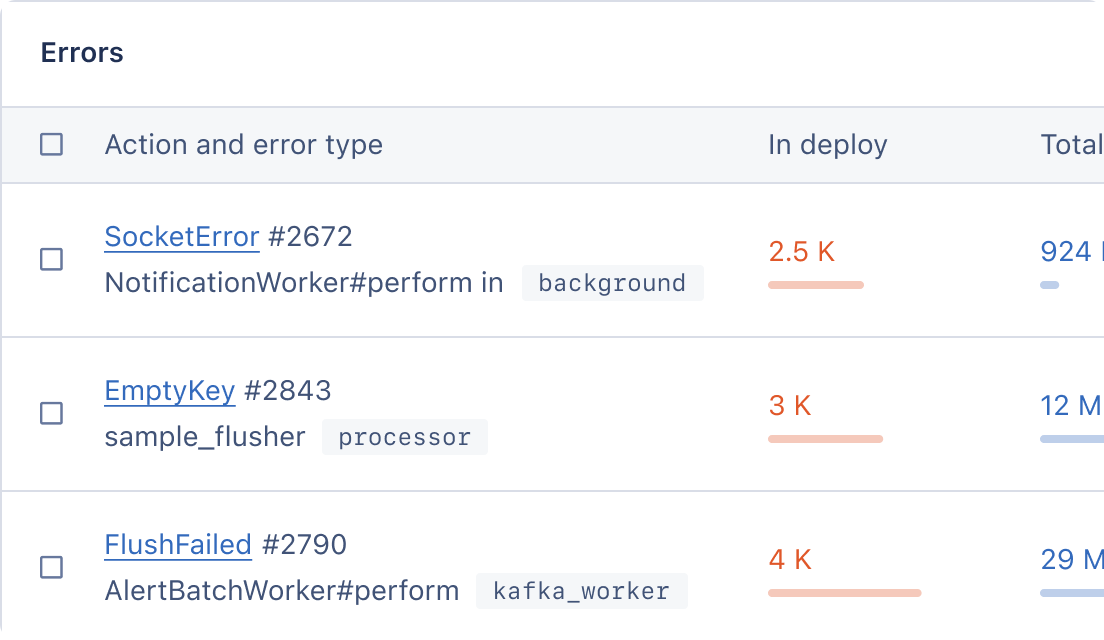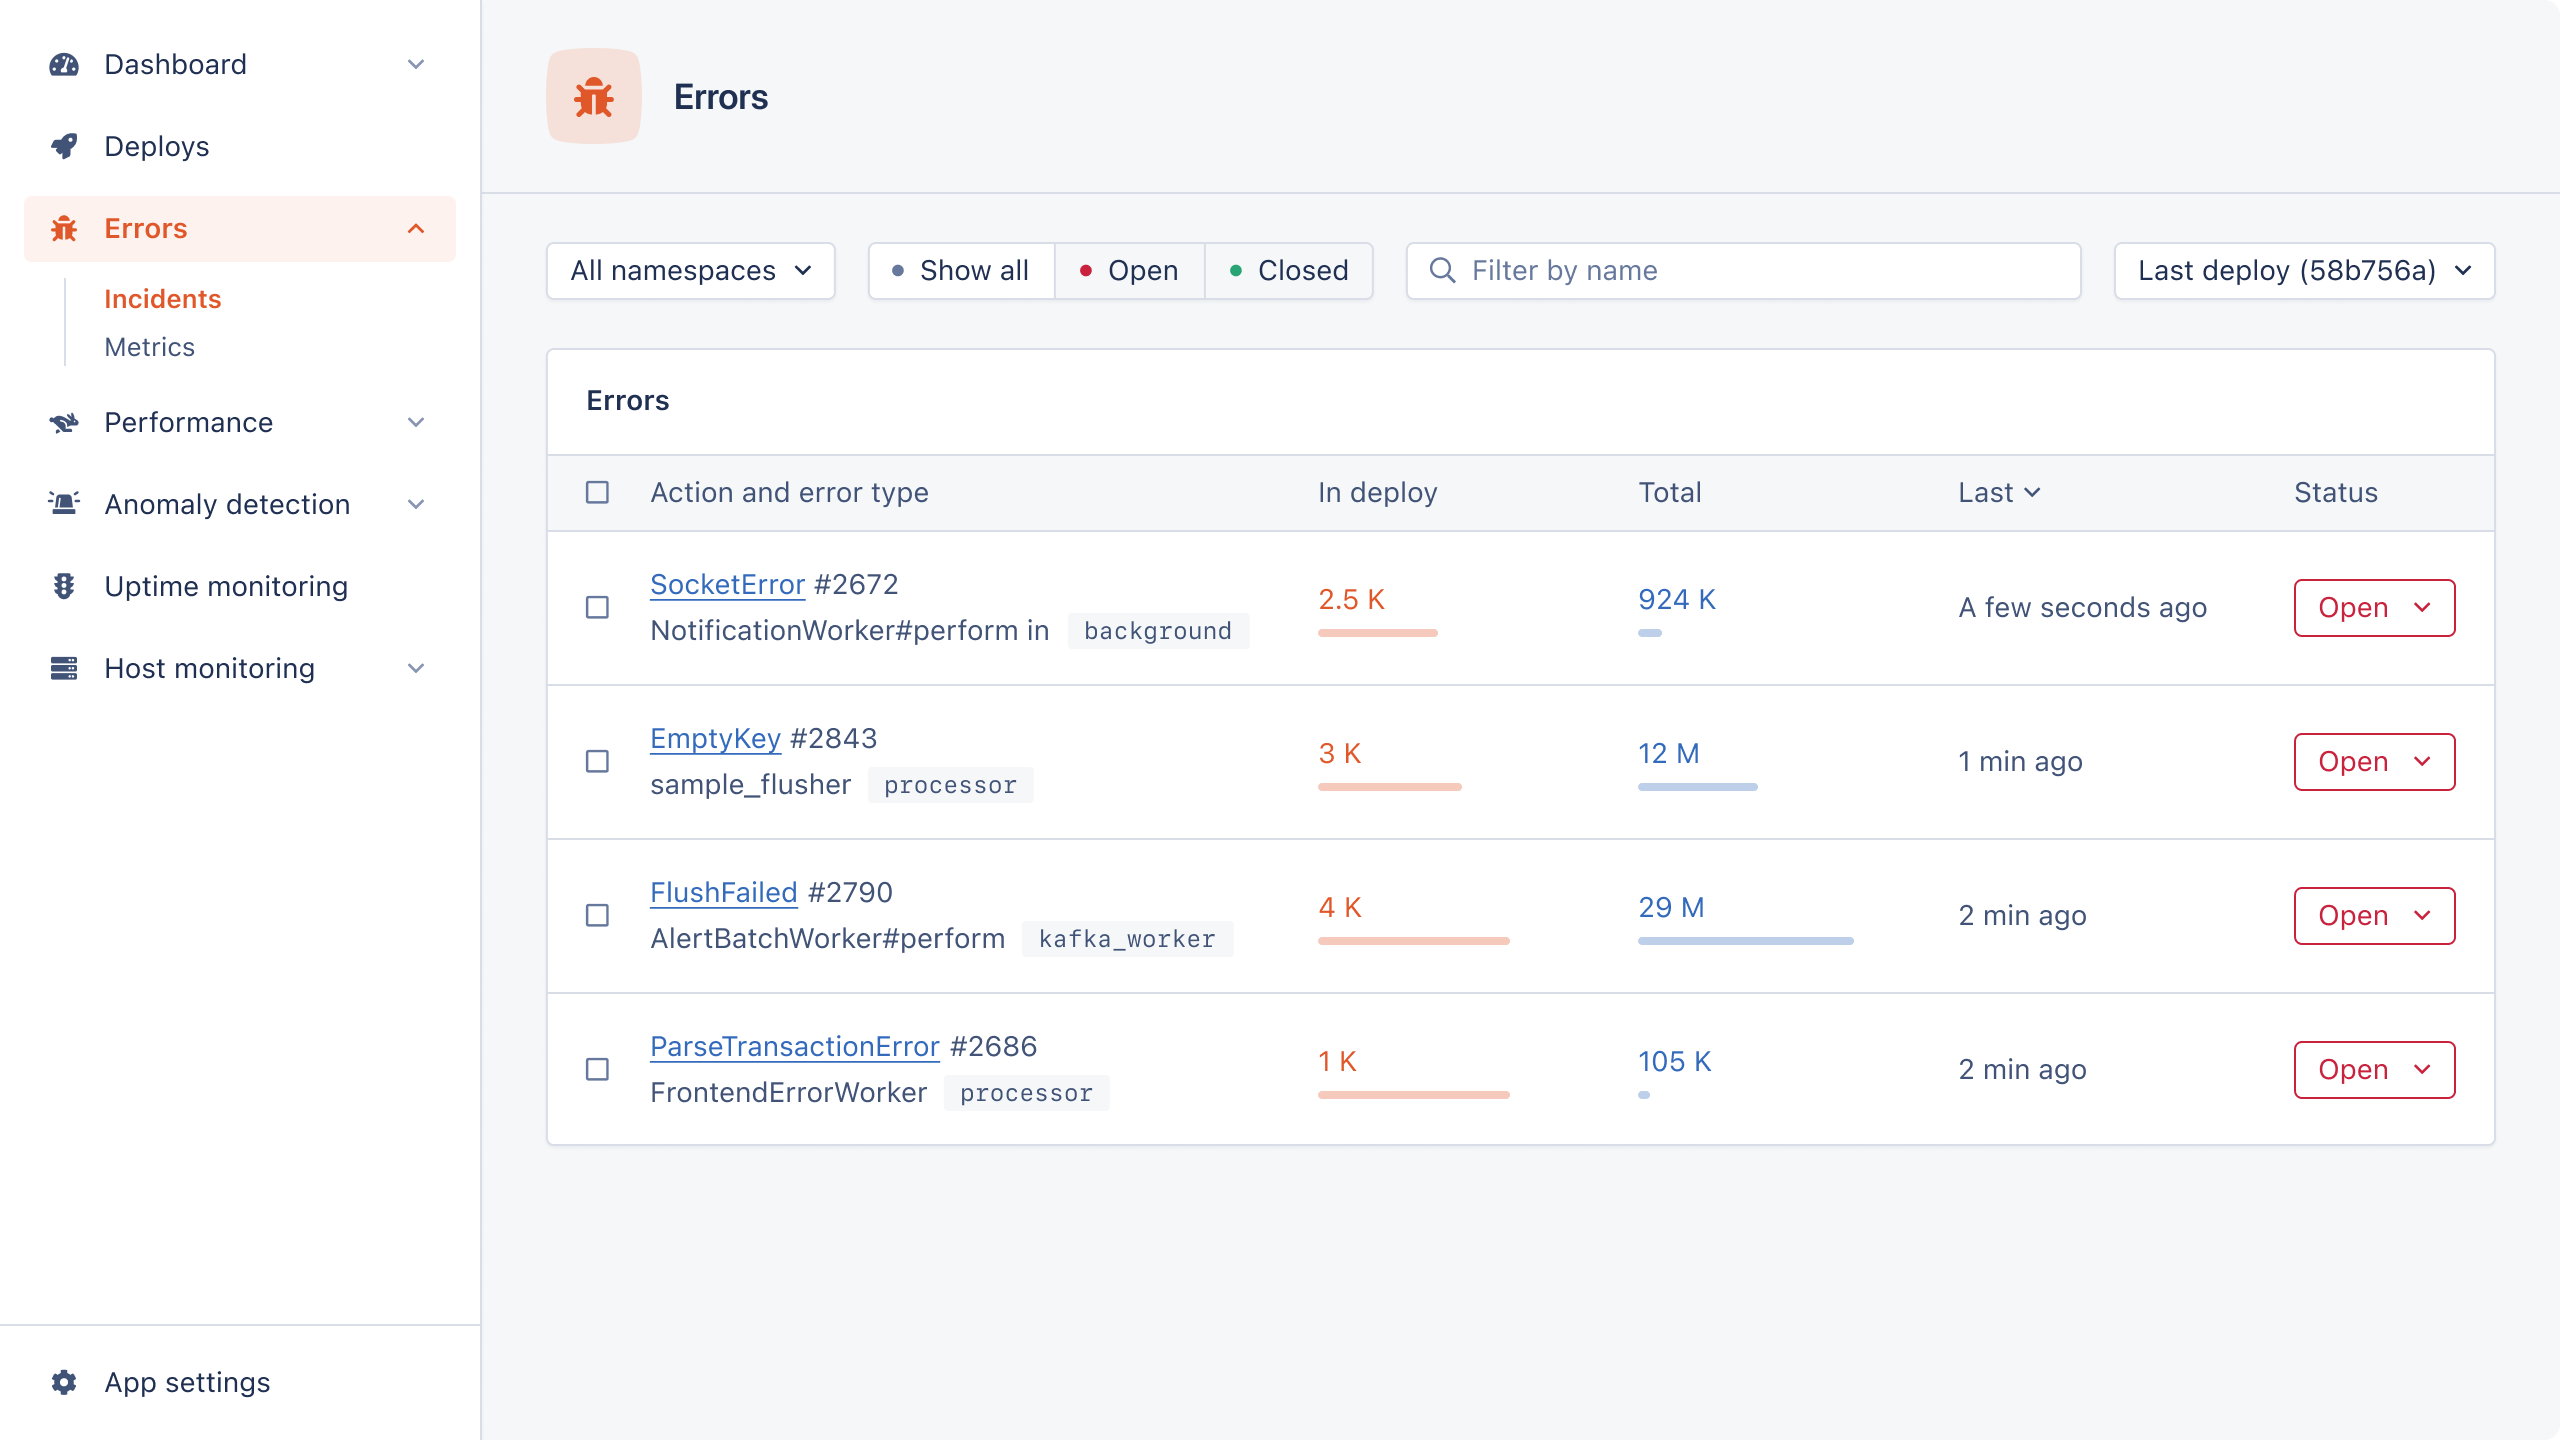
Most web apps can benefit from a background queue, often used to process error-prone or time-consuming side jobs. These background jobs can vary from sending emails, to updating caches, to performing core business logic.
As any background queueing system scales the number of jobs it needs to process, the pool of workers processing those jobs needs to scale as well. In cases where the rate of jobs being enqueued varies, scaling the number of queue workers up becomes a key aspect in maintaining processing speed. Additionally, scaling down workers during low queue throughput can provide significant savings!
Unfortunately, many queueing backends don't come equipped with scaling logic to turn workers on or off. But we can use some simple math and performance data to find our optimal worker count based on the work waiting in the queue.
Queueing Rule of Thumb
If jobs are enqueued at a higher rate than they are processed by the queue workers, the depth of the queue will grow and the time that each job spends in the queue will also grow. Generally, we want the wait time (amount of time in the queue) for each job to be as low as possible — from 0 seconds up to some acceptable limit. To estimate the number of workers required to satisfy a desired wait time, we can use the Queueing Rule of Thumb (QROT). Usually, the QROT is expressed as an inequality describing the number of servers required to service a queue of jobs, but one form can be written as:
workers = (number_of_jobs * avg_service_time_per_job) / time_to_finish_queue
So, if we want to figure out the number of workers required to service our queue in a desired time of, say, 30 seconds, we just need to know the number of jobs (size of the queue) and the average time it takes to execute each job. For example, if we have a queue of 7500 jobs and each job takes an average of 0.3 seconds to execute, then we can finish that queue in 30 seconds with 75 workers.
Accessing Performance Metrics
In order to estimate the average service time for jobs in the queue, we need access to performance metrics for each job class. Luckily, AppSignal records the performance data for common queueing backends out-of-the-box, recording metrics for each time a job has been executed.
We can use the upcoming AppSignal GraphQL API to get the average duration of each job type over the last 24 hours. This API is not fully public yet, though it is currently used for AppSignal's Performance graphs and other data displays. Luckily, GraphQL APIs are intended to be self-documenting, and we can use a tool like GraphiQL to introspect the API and find out what data objects it exposes.
The process of building a GraphQL query is outside the scope of this post, but below is an example Ruby class that connects to the AppSignal GraphQL API using the popular Faraday HTTP client library to query for a basic metrics aggregation.
require 'json'
require 'faraday'

class AppsignalClient
  BASE_URL = 'https://appsignal.com/'
  DEFAULT_APP_ID = ENV['APPSIGNAL_APP_ID']
  DEFAULT_TOKEN = ENV['APPSIGNAL_API_TOKEN']
  # GraphQL query to fetch the "mean" metric for the selected app.
  METRICS_QUERY = <<~GRAPHQL.freeze
    query($appId: String!, $query: [MetricAggregation!]!, $timeframe: TimeframeEnum!) {
      app(id: $appId) {
        metrics {
          list(timeframe: $timeframe, query: $query) {
            start
            end
            rows {
              fields {
                key
                value
              }
            }
          }
        }
      }
    }
  GRAPHQL

  def initialize(app_id: DEFAULT_APP_ID, client_secret: DEFAULT_TOKEN)
    @app_id = app_id
    @client_secret = client_secret
  end

  # Fetch the average duration for a job class's perform action
  # Default timeframe is last 24 hours
  def average_job_duration(job_class, timeframe: 'R24H')
    response =
      connection.post(
        'graphql',
        JSON.dump(
          query: METRICS_QUERY,
          variables: {
            appId: @app_id,
            timeframe: timeframe,
            query: [
              name: 'transaction_duration',
              headerType: legacy
tags: [
                { key: 'namespace', value: 'background' },
                { key: 'action', value: "#{job_class.name}#perform" },
              ],
              fields: [{ field: 'MEAN', aggregate: 'AVG' }],
            ],
          }
        )
      )
    data = JSON.parse(response.body, symbolize_names: true)
    rows = data.dig(:data, :app, :metrics, :list, :rows)
    # There may be no metrics in the selected timeframe
    return 0.0 if rows.empty?

    rows.first[:fields].first[:value]
  end

  private

  def connection
    @connection ||= Faraday.new(
      url: BASE_URL,
      params: { token: @client_secret },
      headers: { 'Content-Type' => 'application/json' },
      request: { timeout: 10 }
    ) do |faraday|
      faraday.response :raise_error
      faraday.adapter Faraday.default_adapter
    end
  end
end
With this class, we can get an average job duration for a given ActiveJob class, returned to us in milliseconds:
AppsignalClient.new.average_job_duration(MyMailerJob)
# => 233.1
By default, this calls for the average transaction duration of the job over the last 24 hours of data.
If our job(s) are executed much more frequently than that, we may want to shorten that window, weighing recent executions more heavily in our average.
For example, if we have jobs that run hundreds of times an hour, we may want to change our timeframe to one hour (R1H) to better estimate the duration of one such job if executed right now.
Note that this performance data is separate from our server utilization data. This data tells us how long it'll actually take to do the work required for each job. This will be more useful to us in scaling our workers than external measurements like utilization metrics.
Introspecting the Queue
Next, we need to introspect our queue to determine the jobs to be serviced.
A common Ruby queueing backend is Resque, which also integrates nicely with ActiveJob.
We can access the enqueued jobs for a given queue in Resque and then estimate the execution time for each job based on its class, using our AppsignalClient class from above.
require 'resque'

class ResqueEstimator
  def initialize(queue: 'default')
    @queue = queue
    @cache = {}
    @appsignal_client = AppsignalClient.new
  end

  def enqueued_duration_estimate
    Resque.data_store.everything_in_queue(queue).map do |job|
      estimate_job_duration decode_activejob_args(job)
    end.sum
  end

  def estimate_job_duration(job)
    @cache[job['job_class']] ||= @appsignal_client
                                 .average_job_duration job['job_class']
  end

  private

  # ActiveJob-specific method for parsing job arguments
  # for ActiveJob+Resque integration
  def decode_activejob_args(job)
    decoded_job = job
    decoded_job = Resque.decode(job) if job.is_a? String
    decoded_job['args'].first
  end
end
Using this class is as simple as:
ResqueEstimator.new(queue: 'my_queue').enqueued_duration_estimate
# => 23000 (ms)
Notice that we use a simple memoization of the job durations in our estimate_job_duration method to avoid duplicate calls to the AppSignal API.
Most likely, our queue will contain many jobs of the same class and we can reduce our overhead by only estimating the execution of each class once.
Using Performance Data to Scale
Pulling all this together, we can now use our recent performance data to scale our queue workers up or down based on the content of our queue! At any moment, we can look at the jobs in our queue and get an estimate of the workers required to service it in our desired time limit.
We will need to decide on a desired queueing time limit (the maximum amount of time any job should wait in the queue), e.g. 30 seconds. We will also need to specify a minimum and maximum worker count. It's helpful to keep at least one worker running for the queue, to handle the first job(s) enqueued after the queue has been empty for a while. We will also want a maximum worker count, to avoid over-scaling our database connections and/or server utilization costs with too many workers.
We can make a class to handle this logic for us, which is basically just our implementation of the Queueing Rule of Thumb from before.
class ResqueWorkerScaler
  def initialize(queue: 'default', workers_range: 1..100, desired_wait_ms: 300_000)
    @queue = queue
    @workers_range = workers_range
    @desired_wait_ms = desired_wait_ms
    @estimator = ResqueEstimator.new(queue: @queue)
  end

  def desired_workers
    total_time_ms = @estimator.enqueued_duration_estimate
    workers_required = [(total_time_ms / desired_wait_ms).ceil, workers_range.last].min
    [workers_required, workers_range.first].max
  end

  def scale
    # using platform-specific scaling interface, scale to desired_workers
  end
end
We will want to scale our workers on a regular interval so that we are scaling up and down based on demand. We can make a Rake task that calls our ResqueWorkerScaler class to scale workers:
# inside lib/tasks/resque_workers.rake

namespace :resque_workers do
  desc 'Scale worker pool based on enqueued jobs'
  task :scale, [:queue] => [:environment] do |_t, args|
    queue = args[:queue] || 'default'
    ResqueWorkerScaler.new(queue: queue).scale
  end
end
And then we can set up a cron job to run this Rake task on a regular interval:
*/5 * * * * /path/to/our/rake resque_workers:scale
# scale a non-default queue:
*/5 * * * * /path/to/our/rake resque_workers:scale['my_queue']
Notice that we set the scaling task to run every 5 minutes. Each new worker will take some amount of time to come online and begin processing jobs — likely anywhere from 10-40 seconds, depending on the size of our codebase and the number of gems we use. So, if we try to scale our workers every minute, we will likely be scaling up or down again before our desired changes have taken effect. If our app is only seeing queue usage fluctuate at different times of the day, we can likely call our Rake task at an hourly interval. But if our queue size fluctuates within the hour, we will want to introspect our queue at a more frequent interval, like the 5 minutes above.
Next Steps
Such a system where actual performance data is used to scale infrastructure can be very responsive to demand and resilient to varied usage. Especially in an environment like background processing, where host metrics like memory usage and load average are unlikely to vary, using performance metrics to scale is much more appropriate.
Alternate queue scaling implementations could measure the mean wait time per job instead of introspecting the full queue, but that metric can be unrepresentative when the queue contents and size change rapidly. If our system experiences widely variable load, with lots of jobs enqueueing at once, or widely variable job execution times, then queue introspection is much faster to respond and reliably correct.
But there are some limitations to consider in our queue introspection system. If the queue is sufficiently large, looking at each job for an execution estimate will be prohibitively slow. In such cases, it can be better to find the total job count, then select a random representative sampling of jobs from the queue and calculate the average execution from that sample. Alternatively, if a job class has no performance data associated with it yet, we will need to use an assumed execution time until it has been executed and recorded a few times.
The system outlined above can also be improved significantly with a few tweaks. Consider estimating the execution time for each job class in parallel, as each estimation is isolated and idempotent. We can also update our queue introspection to include those jobs currently being executed by a worker to improve the accuracy of our total service time estimate. For a background processing architecture with multiple queues, we can assign each queue a desired wait time, based on queue priority, and scale workers appropriately.
Queueing systems tend to collect a lot of the highly variable work in any project. With performance data on the execution of the jobs from the queue, we can effectively scale resources to service all that work in a responsive, efficient manner.
Happy scaling!
P.S. If you'd like to read Ruby Magic posts as soon as they get off the press, subscribe to our Ruby Magic newsletter and never miss a single post!


